On this page
I put a deliberately exposed Windows box on the public internet, wired it into Microsoft Sentinel, and waited. The first failed logons arrived within the hour. Inside a single day, the box had logged 26,066 failed authentication attempts from 253 unique source IP addresses, and a single host accounted for more than three quarters of all of it, methodically cycling through usernames like ADMINISTRATOR, USER, ADMIN, OPERATOR, and even ADMINISTRADOR.
The most useful part was not the volume. It was the shape of it, and the one place the data quietly corrected an assumption I had walked in with. That is when the project stopped feeling like a tutorial and started feeling like an experiment.
What the Honeypot Saw#
Over roughly a day of collection, the exposed VM recorded:
- Most-targeted usernames:
ADMINISTRATOR,Administrator,USER,ADMIN,USER2,ADMINISTRADOR,OPERATOR,ADMIN1,SERVER1,MANAGER - One source,
194.180.49.141, generated 19,735 of the 26,066 attempts on its own - Almost every failure logged as Logon Type 3 (network), not Type 10 (RemoteInteractive), which turned out to be the most interesting detail in the whole dataset
The rest of this article is how I built the pipeline that captured all of that, generated the harder-to-find telemetry myself, and turned raw Windows events into detections grounded in what I actually observed rather than textbook examples. Part 2 bolts an AI triage layer onto the incident pipeline so each alert arrives already summarized.
This guide walks through the entire build step by step: a deliberately exposed Windows VM in Azure, Microsoft Sentinel ingesting its security events, custom KQL detections mapped to MITRE ATT&CK, and Alert Rules that incorporates automated responses transforming SIEM functionality into a SOAR that automatically performs actions depending on the rule. The foundation is Josh Madakor's tutorial here. Ever since I first saw this video, I've always wanted to try it out myself so I thought why not now. I did just that, then kept going, because the tutorial stops at a single string-match query and a real detection environment is a different animal. Steps 1 through 5 are the base build; Steps 6 through 7 is when it becomes something closer to a working SOC workflow, and part 2 of this series will incorporate an AI layer that turns raw alerts into analyst-ready summaries. Stay tuned for that. But for now let's establish our foundation first.
Lab only. We are about to put a wide-open Windows box on the public internet. That is the entire experiment, and it is only safe because the VM holds nothing, lives in its own resource group, and gets deleted when we're done. Expose the throwaway, never the real thing.
What You'll Need#
Accounts & Software
- An Azure account - which means a credit card is needed as well (the free tier with $200 in credits is plenty)
- A web browser. Everything in this lab happens in the Azure portal
- Remote Desktop client (built into Windows, free on macOS) to test logons
- Optional, for Part 2(coming soon): access to Azure OpenAI or an OpenAI API key for the AI triage layer
Knowledge
- Basic familiarity with the Azure portal helps but isn't required; every click is shown
- No prior KQL experience needed. Every query is provided and explained
Cost heads-up before we start. Sentinel bills on data ingestion, and a wide-open VM generating thousands of events an hour adds up faster than you'd guess. Deallocate the VM whenever you're not actively collecting, and delete the whole resource group when you're done. My total across about three days of collection was a few dollars. Leave it running and forget it, and that number stops being funny.
Step 1: Create the Honeypot VM#
First we build the bait: a plain Windows VM in its own dedicated resource group.
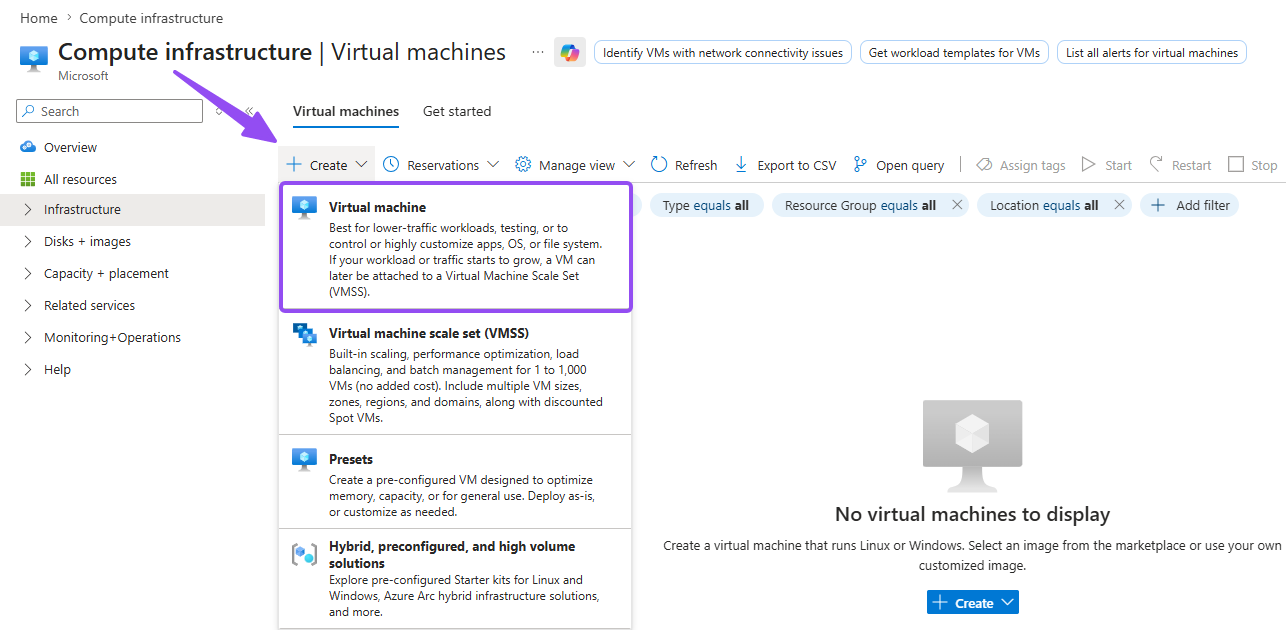
- Sign in to the Azure portal and go to Virtual machines → Create → Azure virtual machine
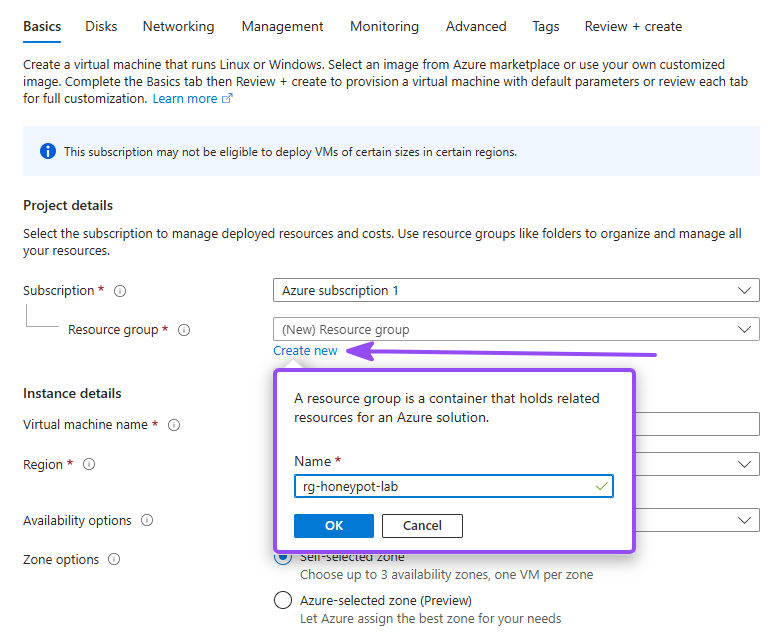
- Under Resource group, click Create new and name it something obvious, e.g.
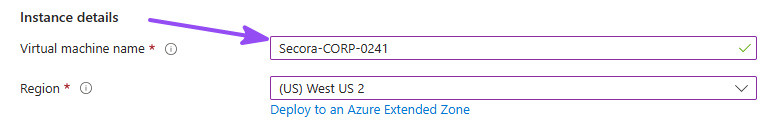
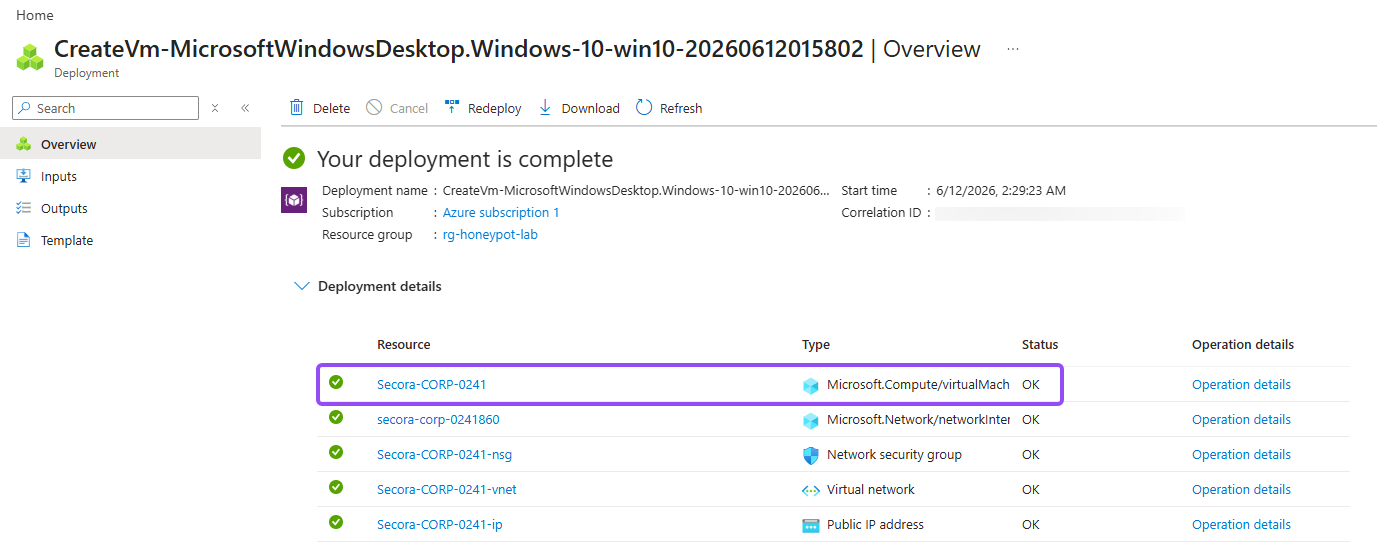
rg-honeypot-lab - Name the VM. I used
Secora-CORP-0241: if you know me from my Active Directory lab writeup, Secora is the fictional company that lab is built around, and formatting the name like a legitimate corporate asset makes the box more enticing to whoever finds it. Then pick a region close to you and remember which one; the workspace must match it later
Why a dedicated resource group? When the lab is over, you delete the group and everything inside it goes with it: VM, disk, NIC, public IP. No orphaned resources quietly billing you.
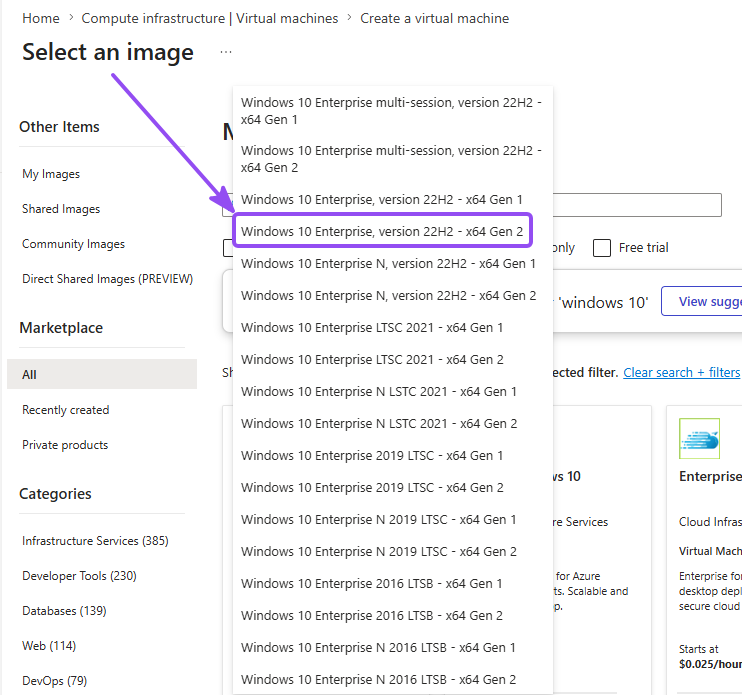
- For Image, make sure you choose Windows 10 Enterprise, version 22H2, since you will get this error if you try to proceed with for example, Windows 11 images: "This virtual machine requires a subscription without any spending limit or temporary payment method set. Use a different subscription or update your subscription (requires account administrator privileges) at [Account Center](https://account.windowsazure.com) to continue."
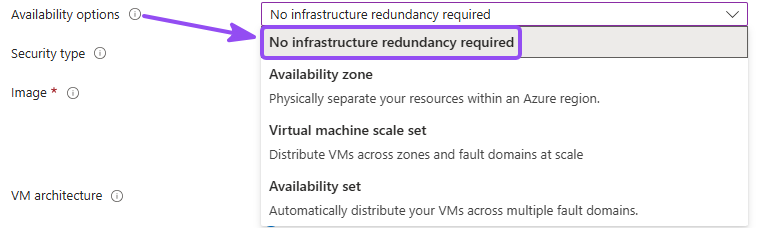
- For Availibility options, make sure you pick No infrastructure redudancy required because choosing avalibility zones for our VMs will restrict certain sizes
- For Size, pick something small but not tiny, around 2 vCPUs and 8 GB RAM is perfect in my opinion (e.g.
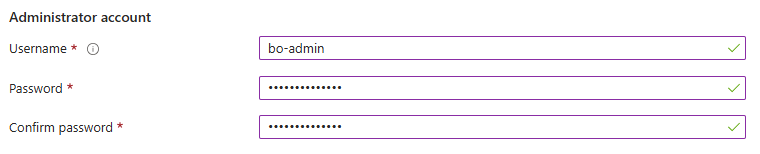
Standard_D2s_v3) - Set a username and password. Write them down; you'll RDP in later to generate test events. (and yes... the
attackers will be trying
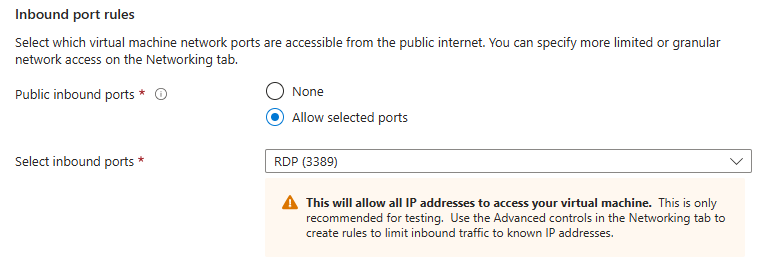
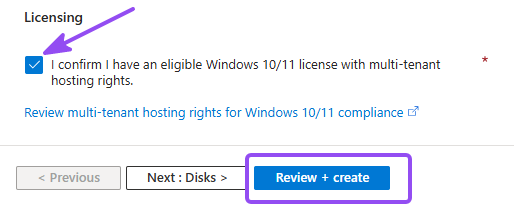
Password123within the hour, so feel free to not use that one!) - Under Inbound port rules, leave RDP (3389) selected
- Checkmark "I confirm I have an eligible Windows 10/11 license with multi-tenant hosting rights.", then Review + Create, then Create and let it deploy
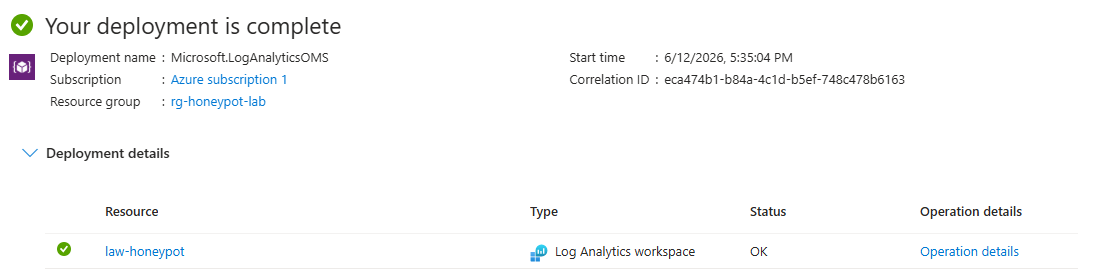
- Deployment might take a couple minutes to finish but eventually you'll end up on a screen that references the screenshot below

Why not the smallest size? The Azure Monitor Agent that ships events to Sentinel has real overhead. Starve the VM and it drops events during I/O spikes, which means you miss the exact bursts of attack activity you built this lab to see.
Step 2: Open It to the Internet#
This is the step that makes it a honeypot. By default Azure gives you a sensible Network Security Group that only allows RDP. We're going to replace it with a rule that allows everything, from everyone, on every port. There are entire compliance frameworks devoted to preventing what you're about to do on purpose. Do it anyway. The point is to make this box impossible for a scanner to ignore.
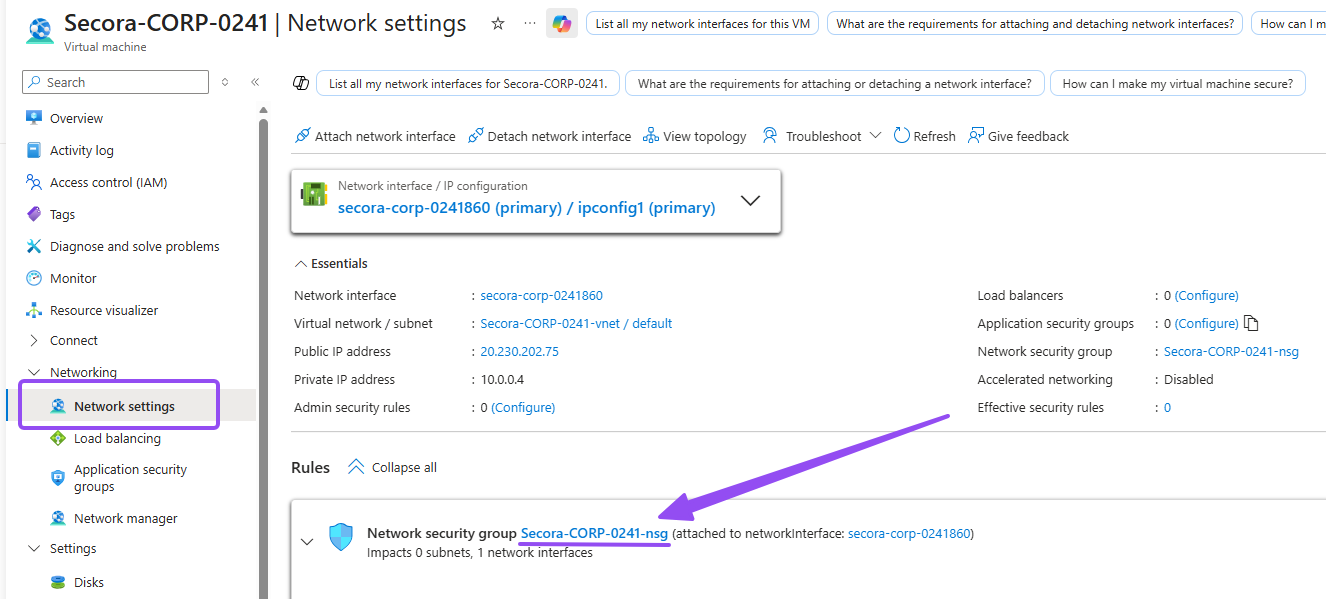
- Open your VM and go to Networking → Network settings, then navigate into your NSG config page. Yours will be named differently, mine is
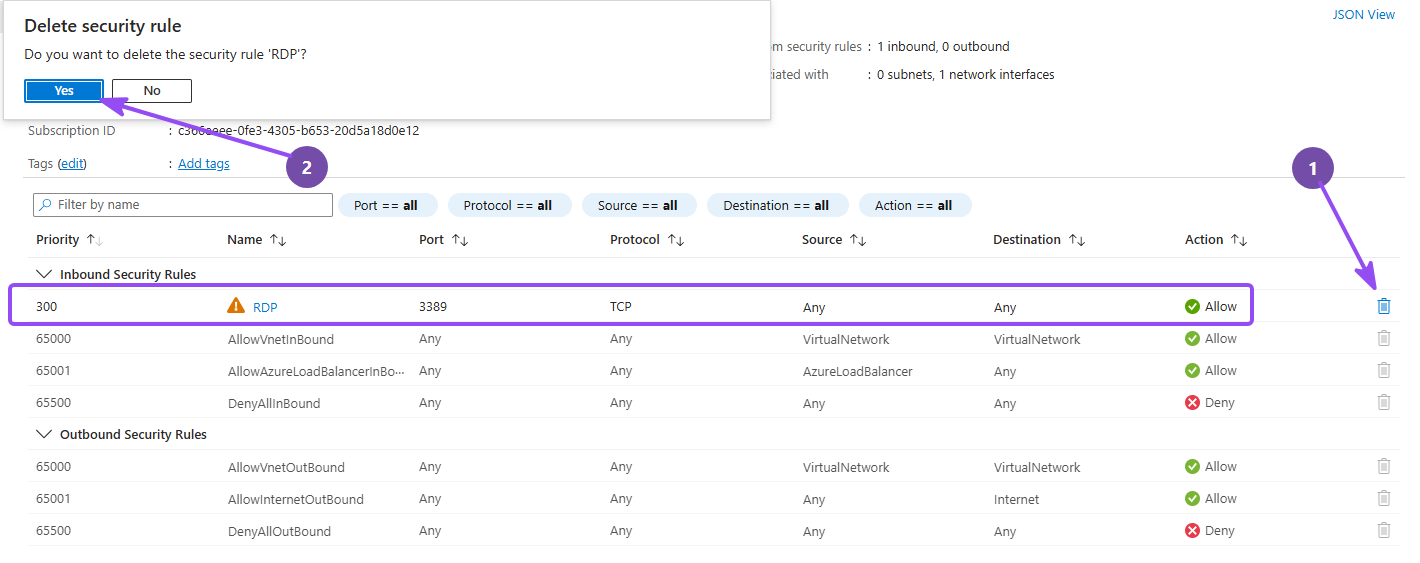
Secora-CORP-0241-nsg - Delete the default
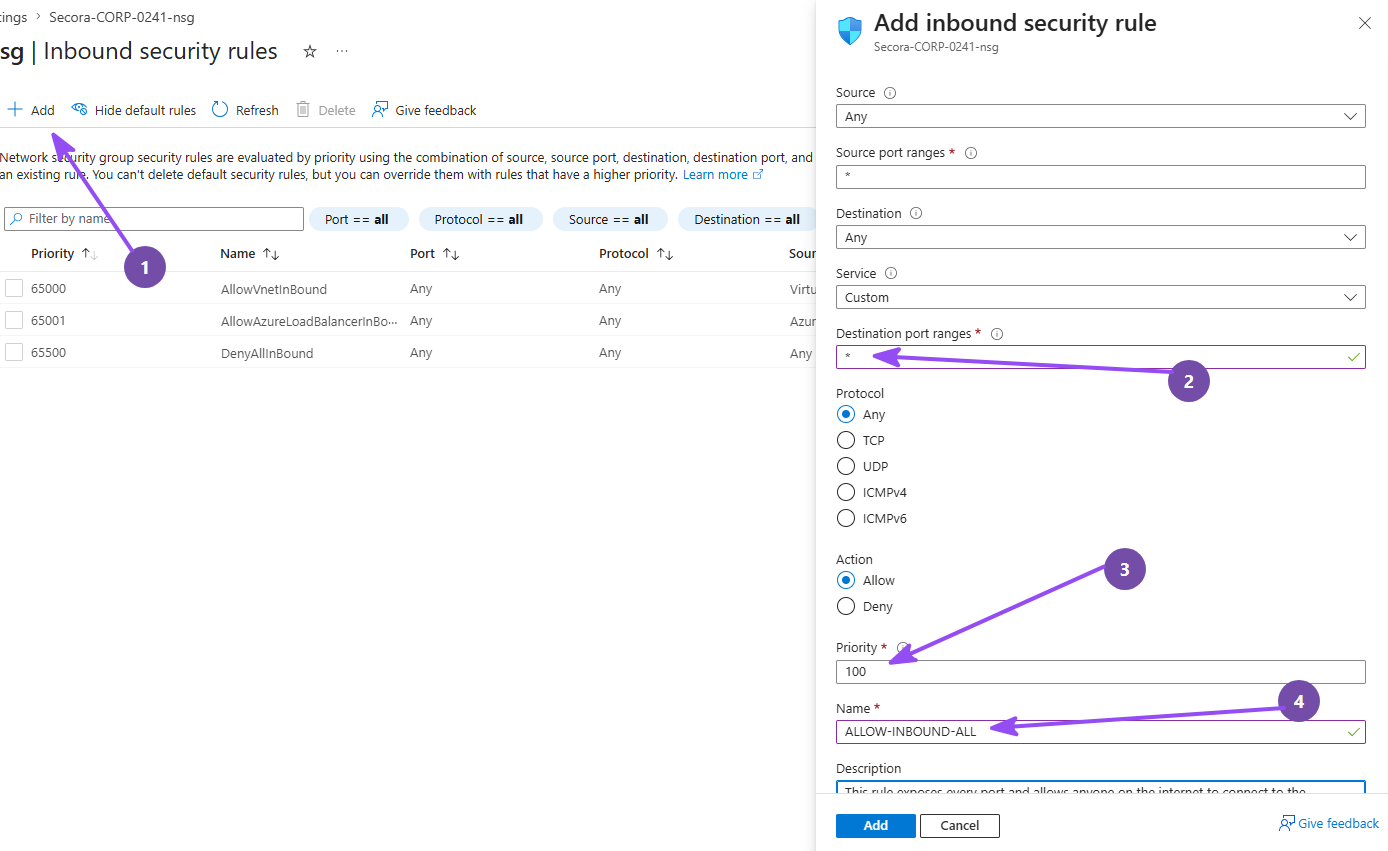
RDPinbound rule under "Inbound security rules" - Click Create port rule → Inbound port rule and set:
- Source: Any
- Source port ranges:
* - Destination: Any
- Destination port ranges:
* - Protocol: Any · Action: Allow
- Priority:
100 - Name:
ALLOW-INBOUND-ALL
- Click Add
Congratulations: you now operate the least secure VM in your Azure region. (exactly as bad as it sounds, and exactly what we want)
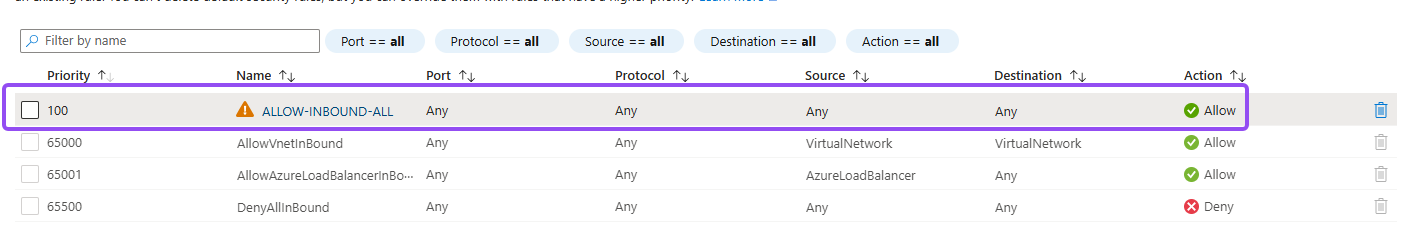
Why priority 100? Lower priority numbers win in Azure, so 100 guarantees this
allow-all rule is evaluated before any default deny. An allow-all inbound rule on a public IP is exactly what you
spend your career preventing; it belongs on this disposable VM and nowhere near anything real.
Step 3: Deploy Microsoft Sentinel#
Here's the part most tend to forget or get confused about: Sentinel doesn't store your logs at all. The Log Analytics Workspace does that, and Sentinel is the analytics and alerting layer sitting on top of it, reading what the workspace holds. That dependency is why we build in this order: the workspace first, then Sentinel enabled on top of it.
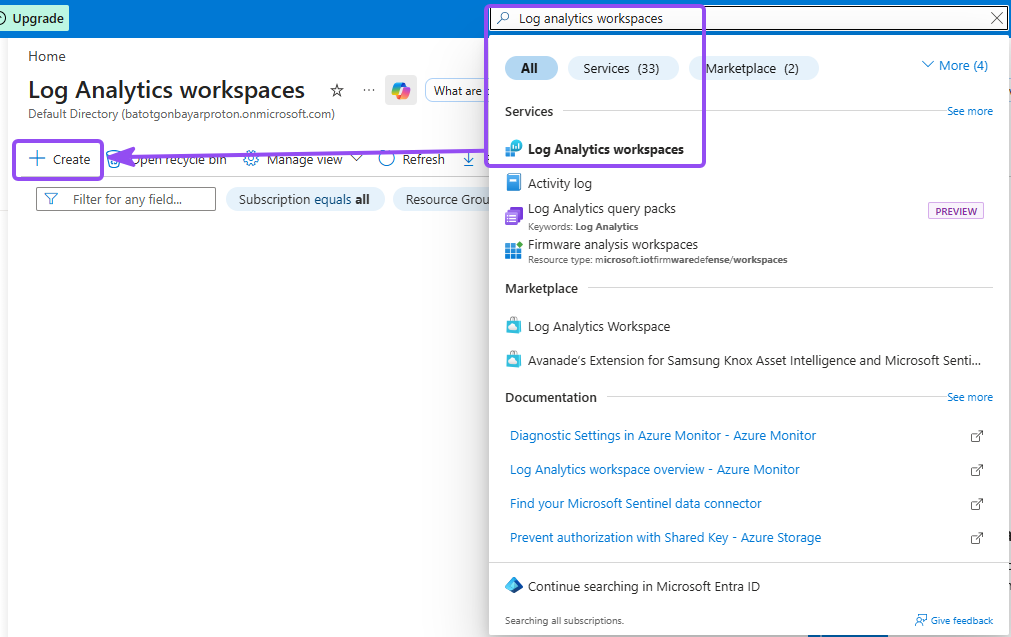
- In the portal search bar, search for Log Analytics workspaces → Create
- Put it in the same resource group as the VM, name it (e.g.
law-honeypot), and pick the same region as your VM - Click Review + create → Create after validation has passed
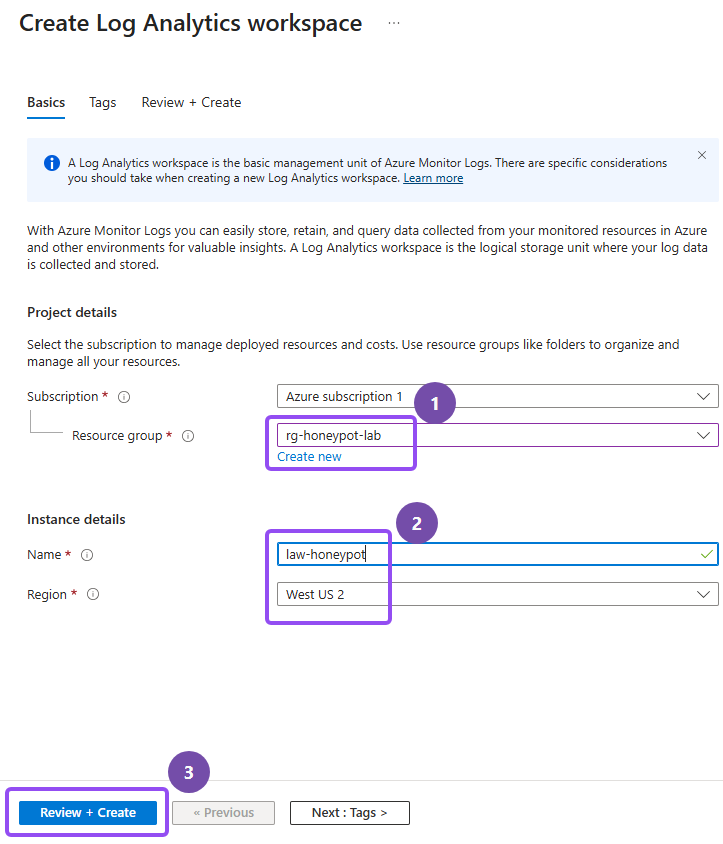
Why the same region? It keeps you out of cross-region data-transfer charges, which is a small thing until your honeypot is ingesting thousands of events an hour.
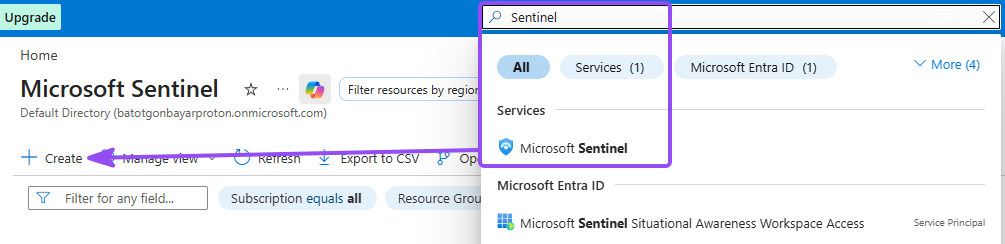
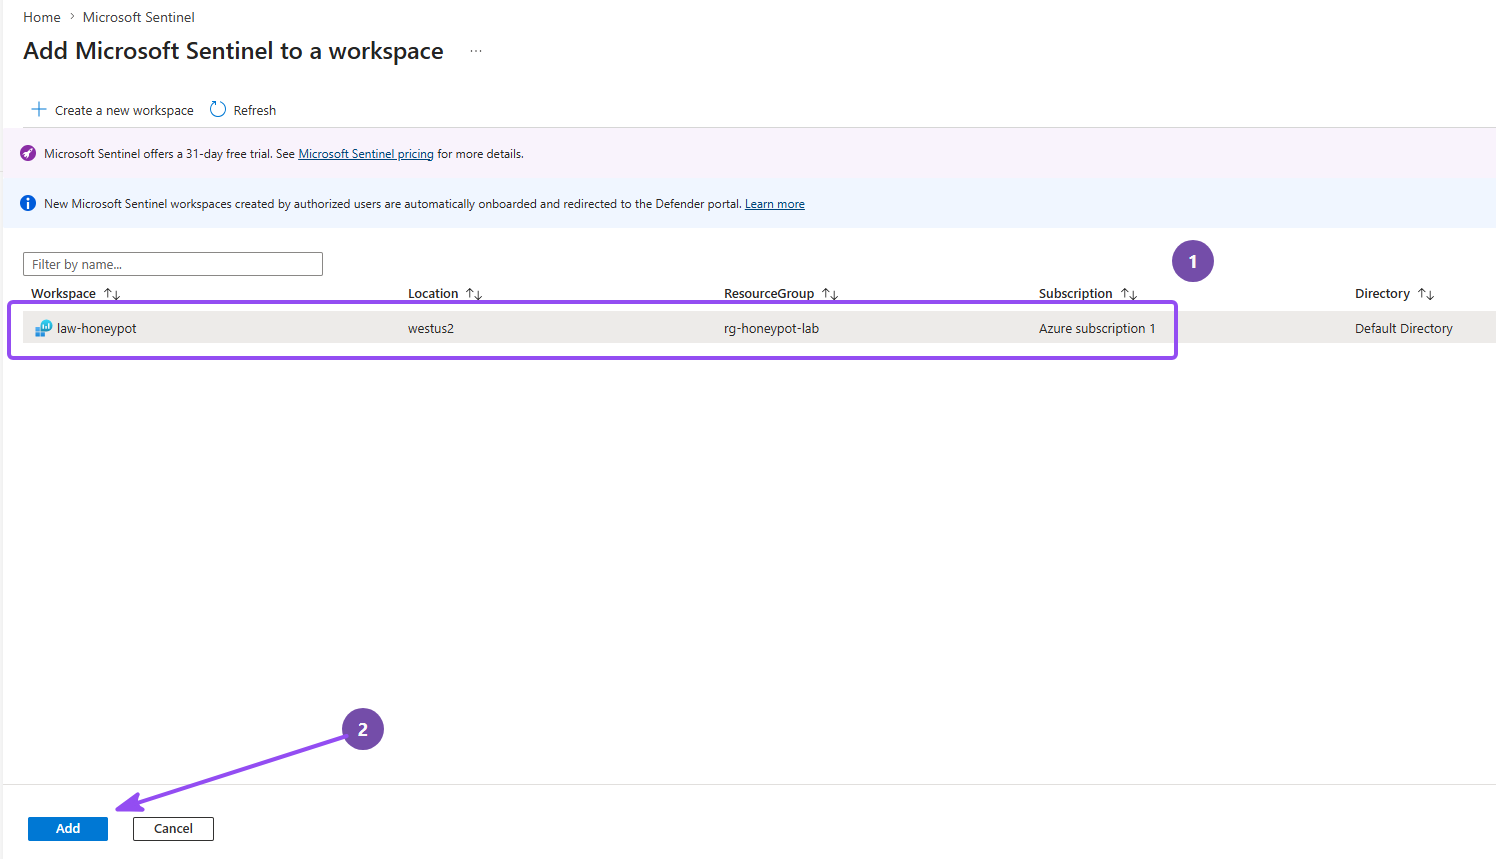
- Now search for Microsoft Sentinel → Create
- Select the workspace you just made and click Add
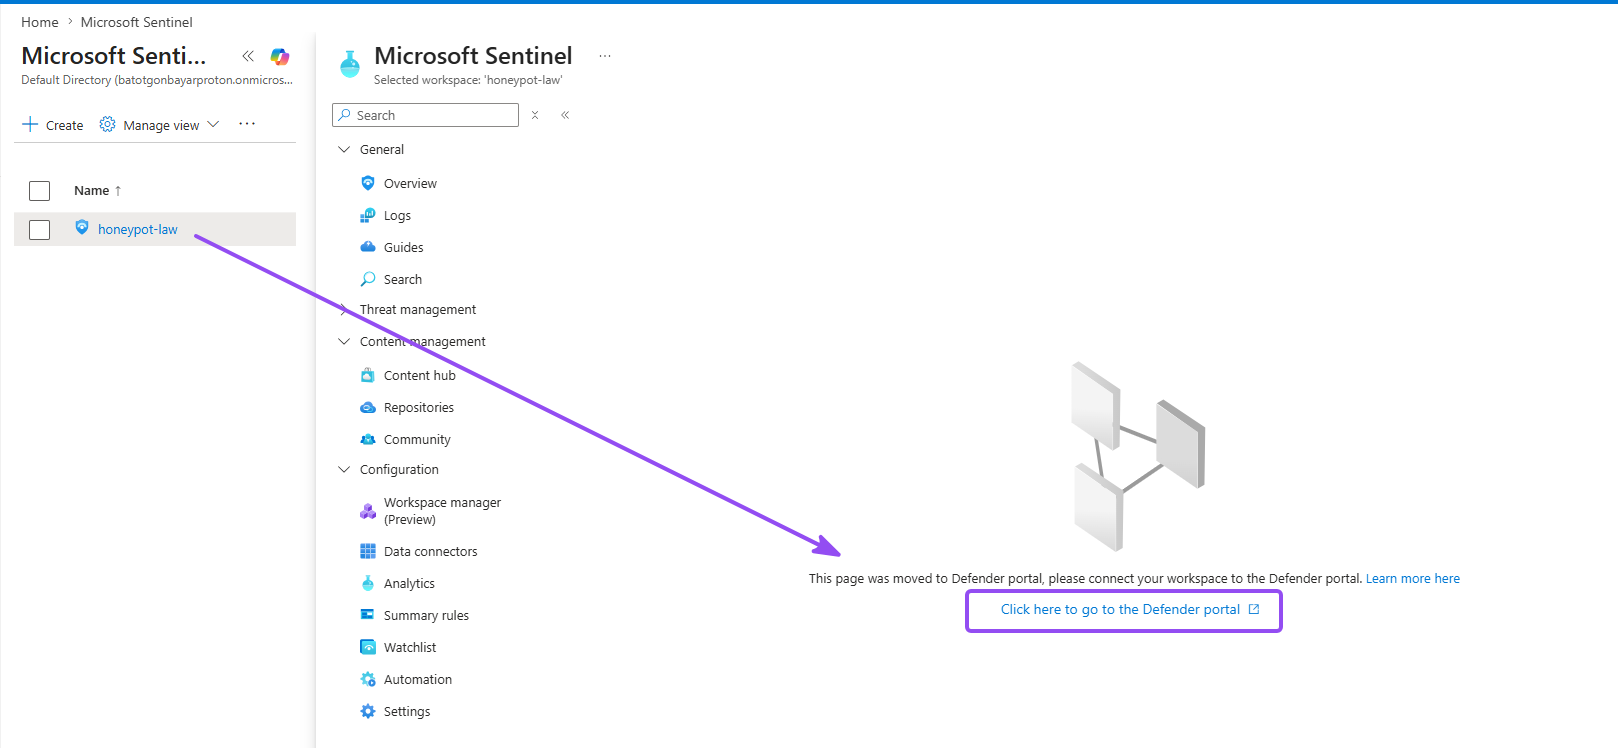
- Access Microsoft Sentinel in the Defender portal
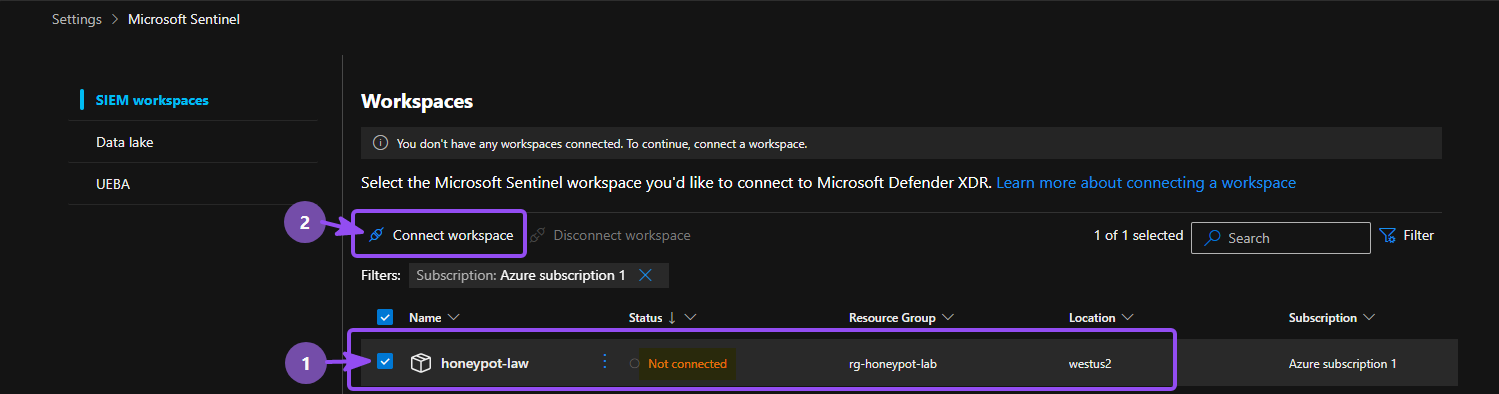
- If this is your first time provisioning a LAW in Sentinel, it might take a couple minutes for Settings under Sentinel to appear. Go to Settings → Microsoft Sentinel → Workspaces, verify yours is listed, select it and click Connect workspace
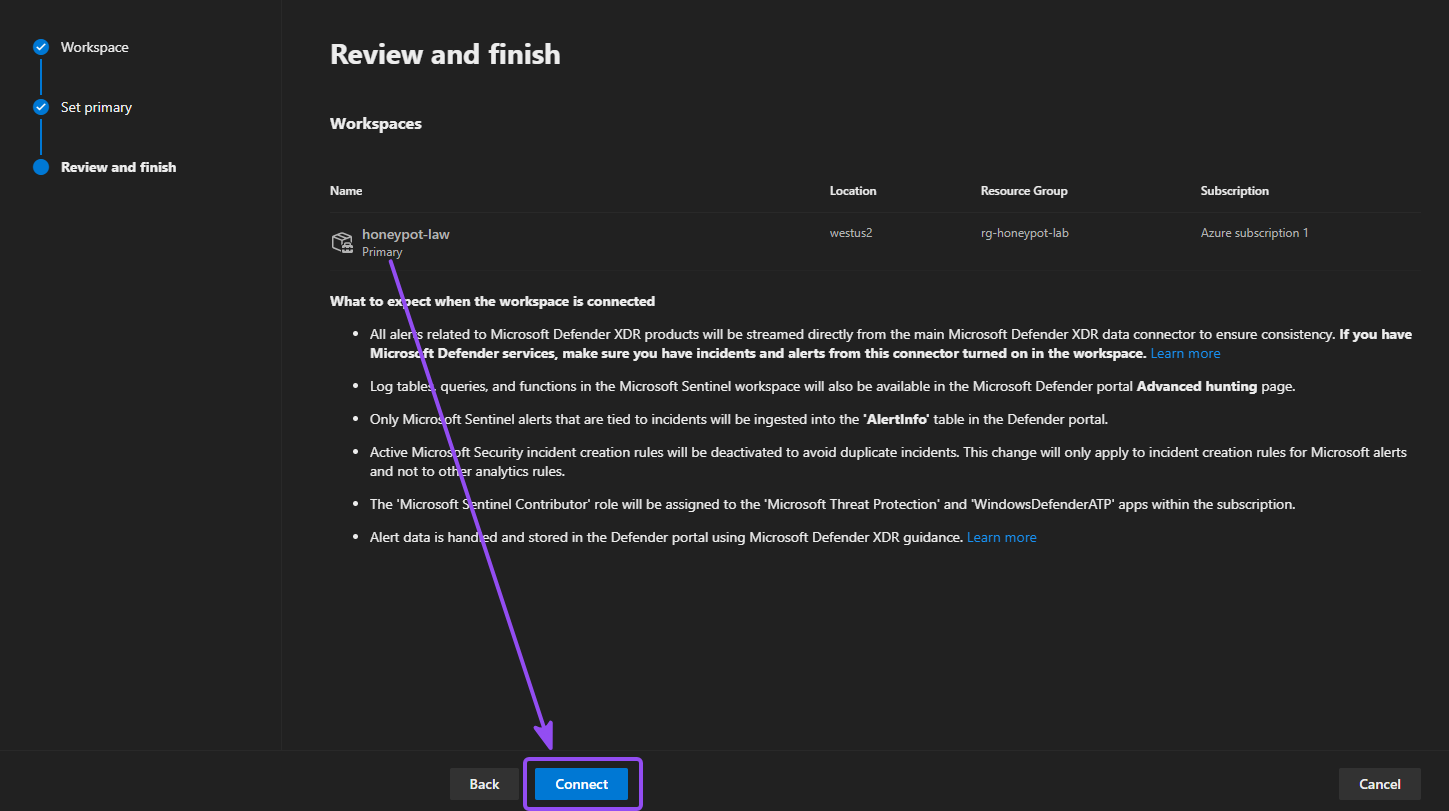
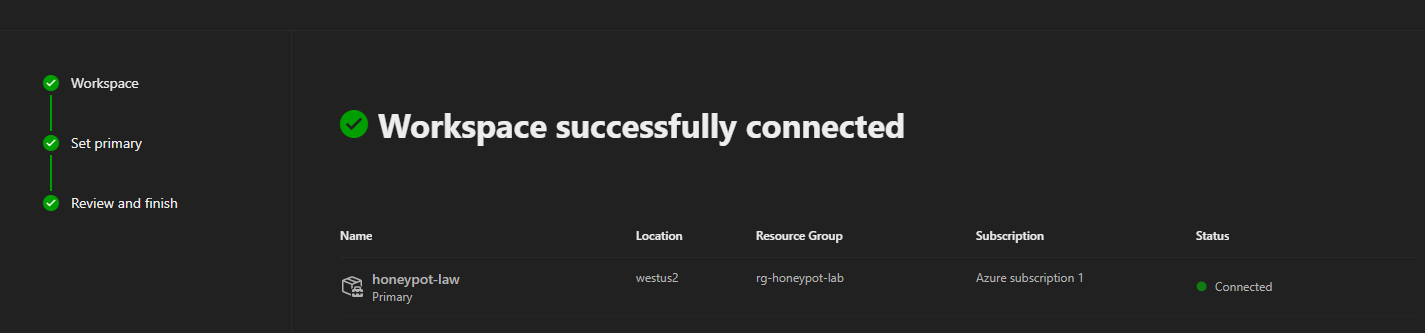
- Then set the workspace as Primary, and click Connect on the Review and Finish page.
Step 4: Connect the VM to Sentinel#
Sentinel can only work with events that actually reach it, and right now nothing does. Two major components play a role here: a data connector, which tells Sentinel what kind of logs to expect, and a Data Collection Rule, which defines exactly which events get shipped from the VM and where they land.
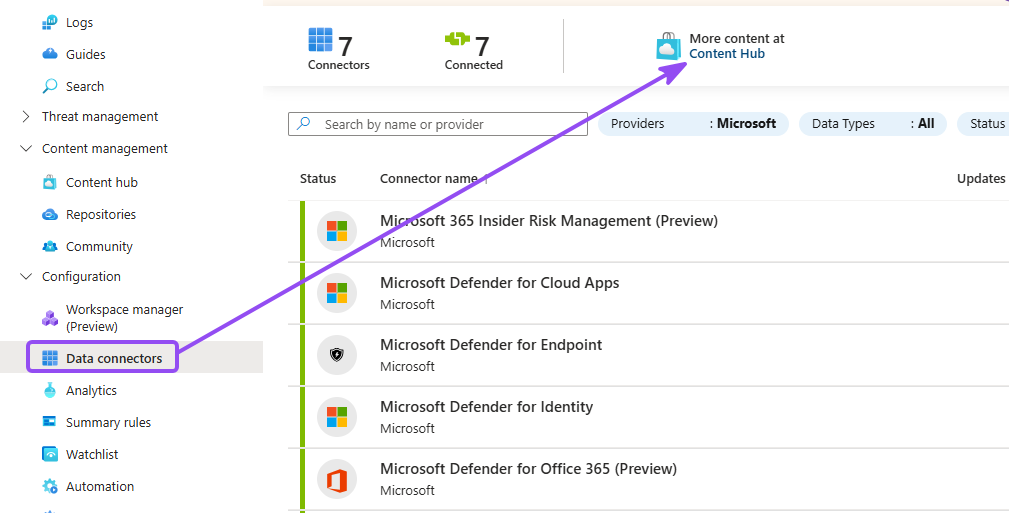
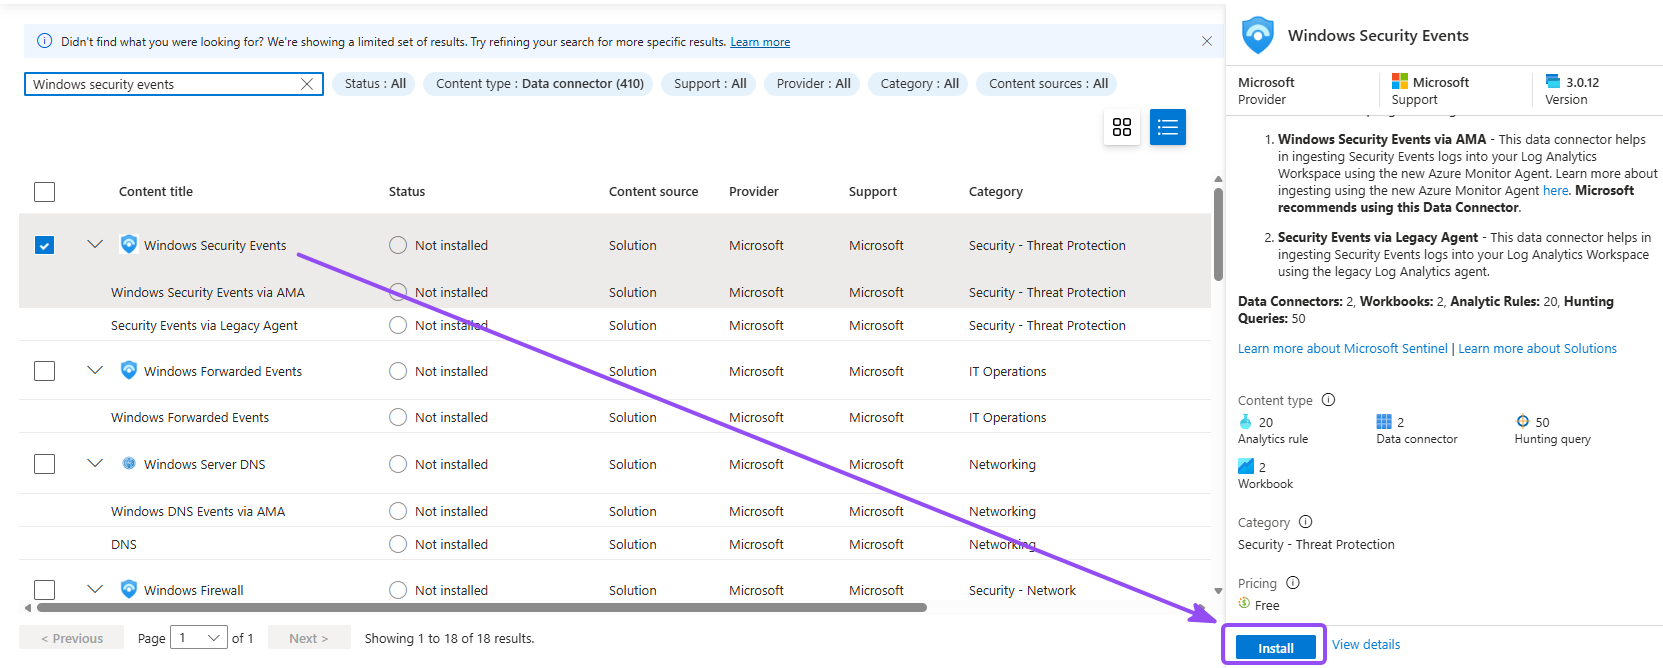
- In Sentinel from Azure portal, go to Data connectors under Configuration, and go to Content hub
- Search for Windows Security Events, and click Install
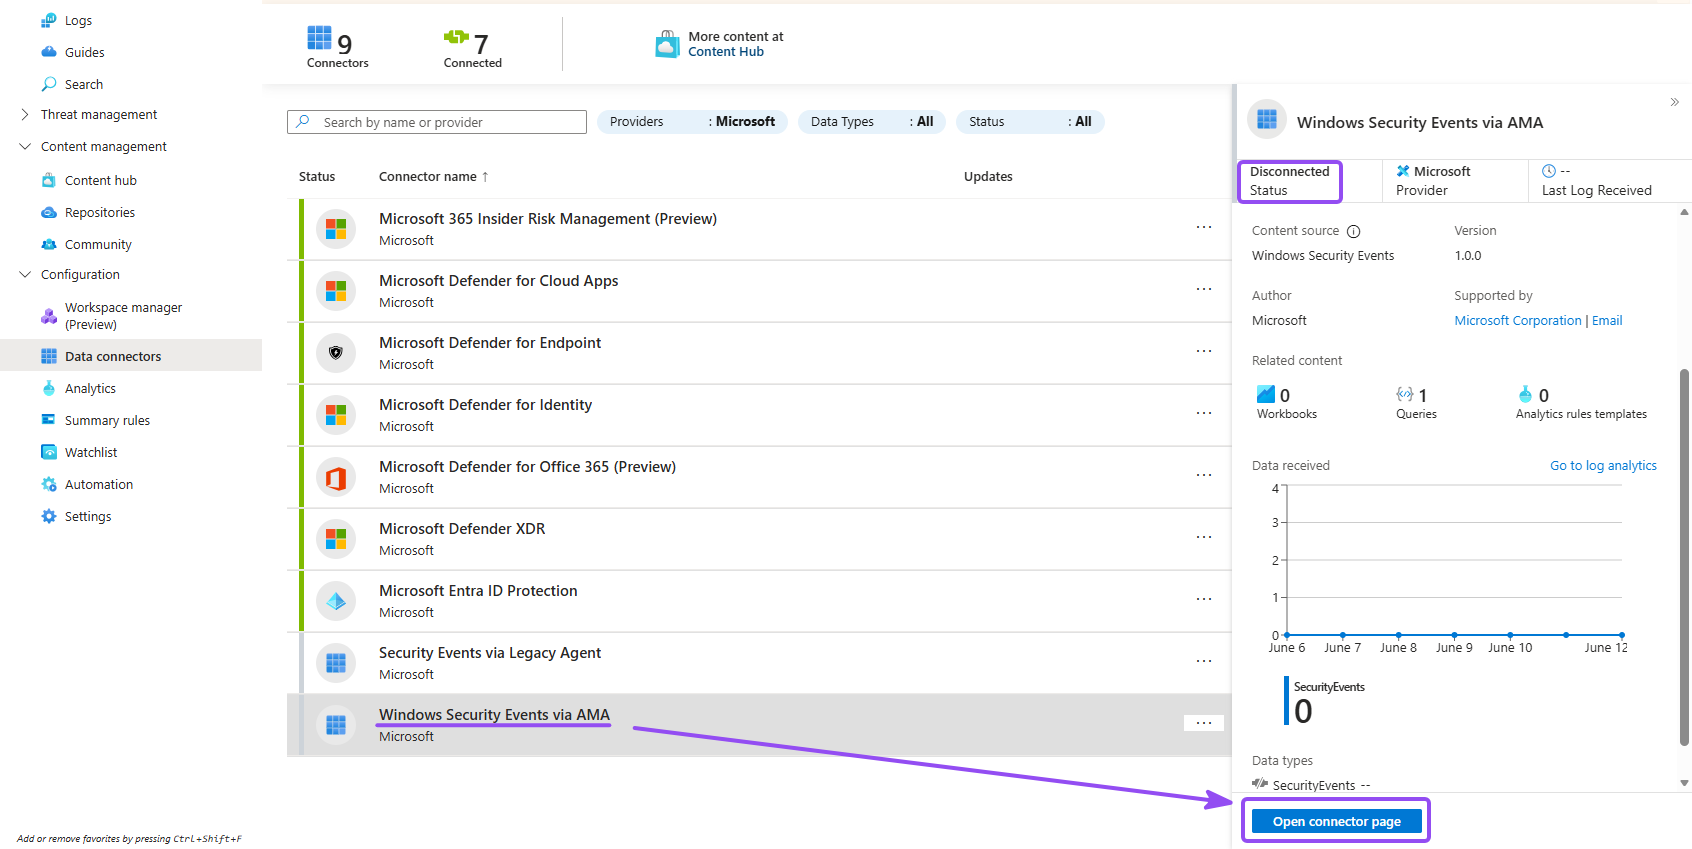
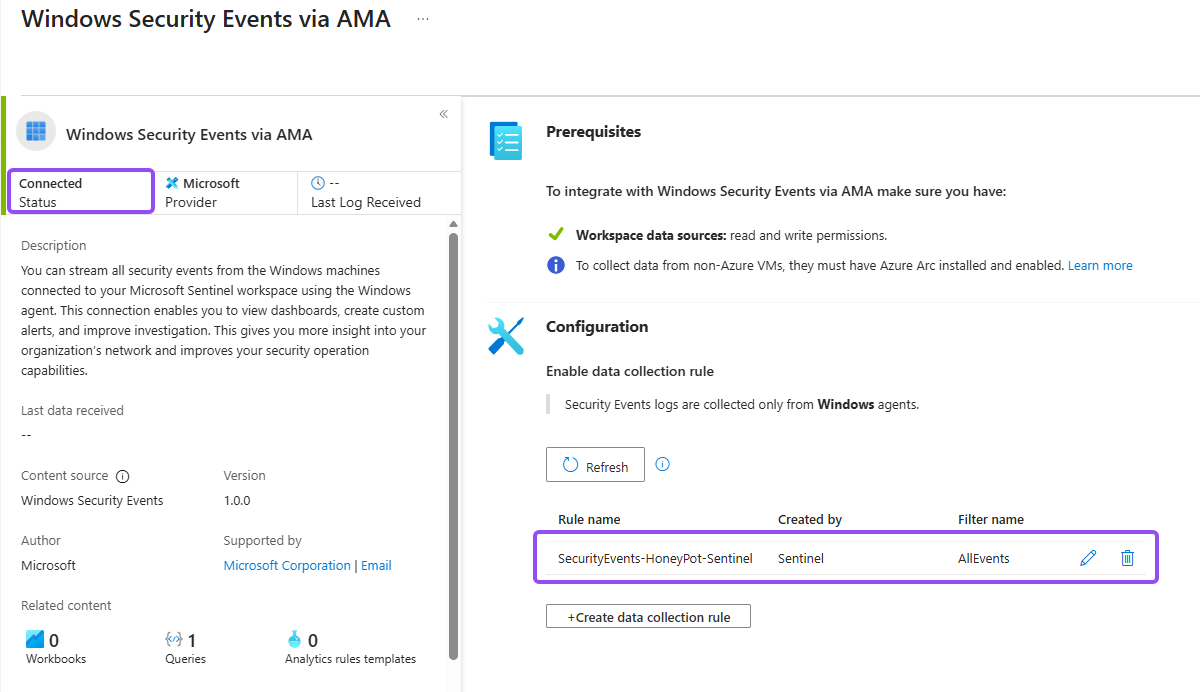
- Go back to Sentinel, refresh, and go to Configuration → Data connectors, open Windows Security Events via AMA, and click Open connector page
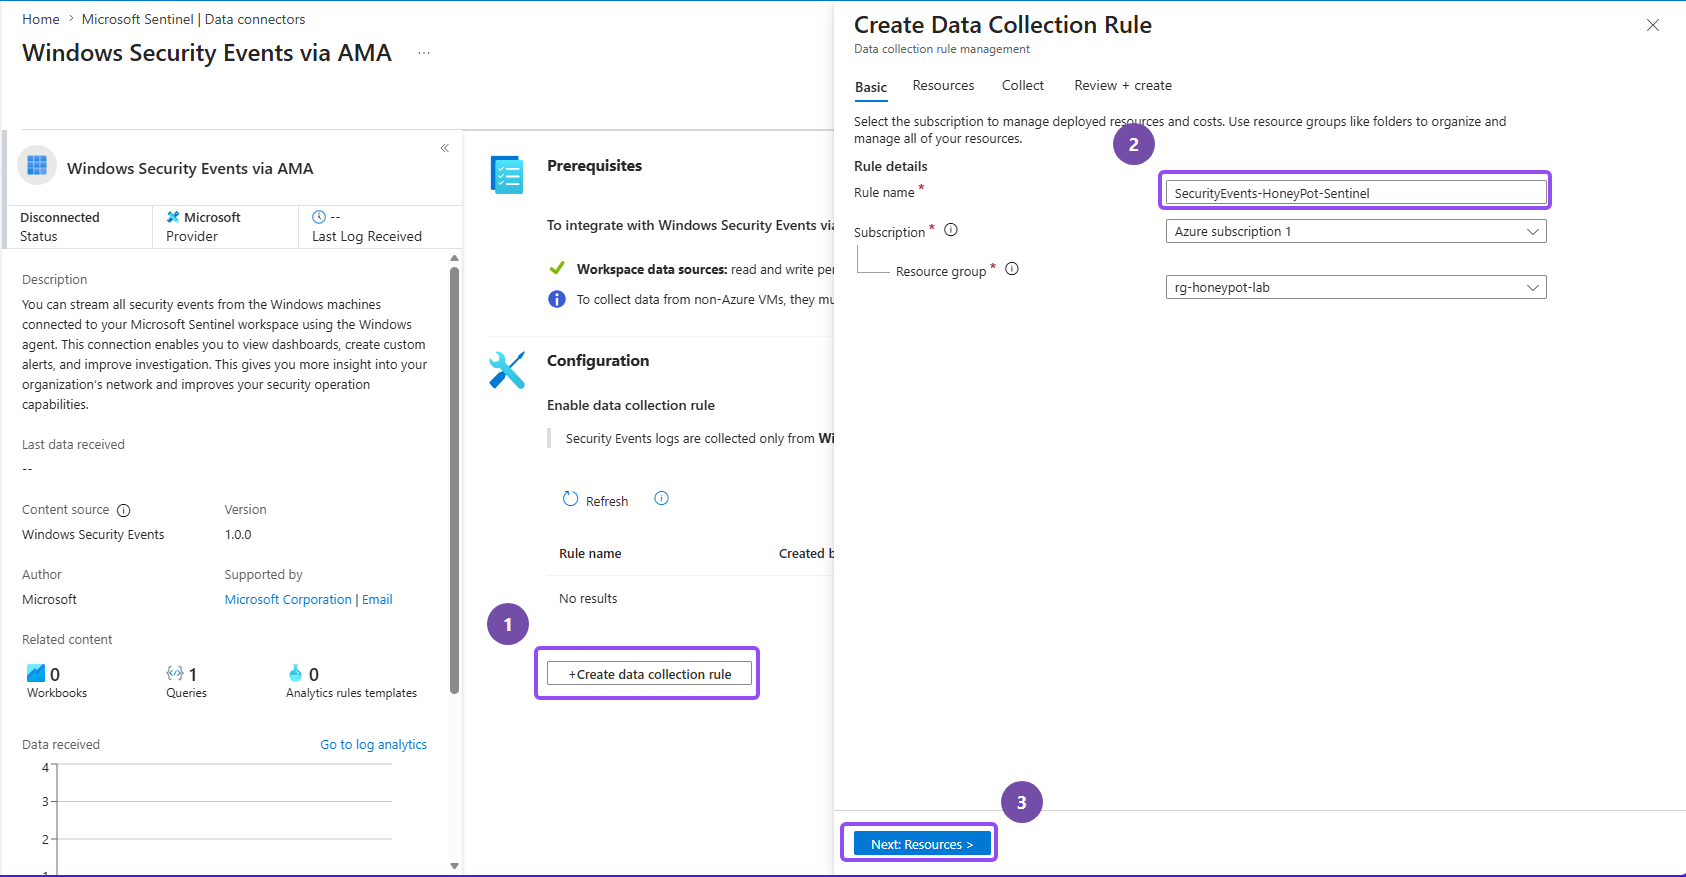
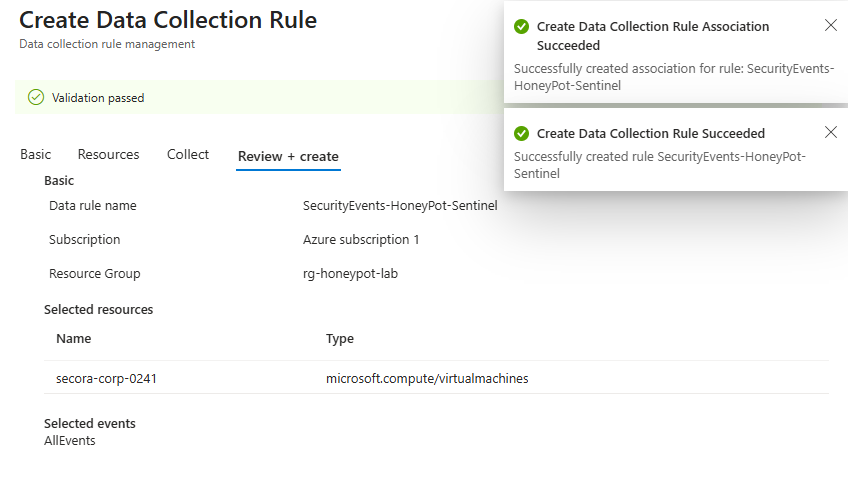
- Click Create data collection rule and name it. e.g.
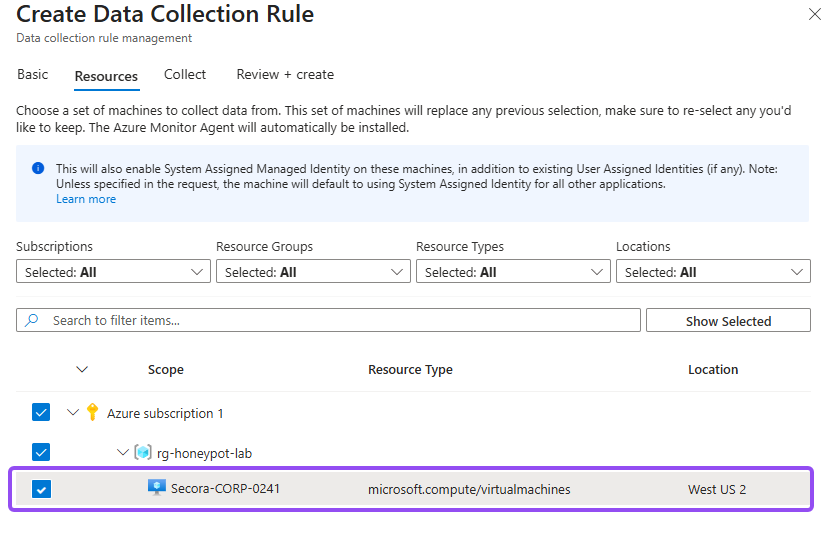
SecurityEvents-Honeypot-Sentinel - Then on the Resources tab, check your honeypot VM
- On the Collect tab, choose All Security Events
- Click Review + create → Create
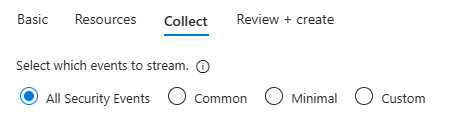
Why All Security Events instead of Common? "Common" drops some of the event IDs that matter for lateral-movement and persistence detection, and for a lab you want the full firehose. In production you'd filter aggressively here to control ingestion cost, but that's a production problem, not a lab one.
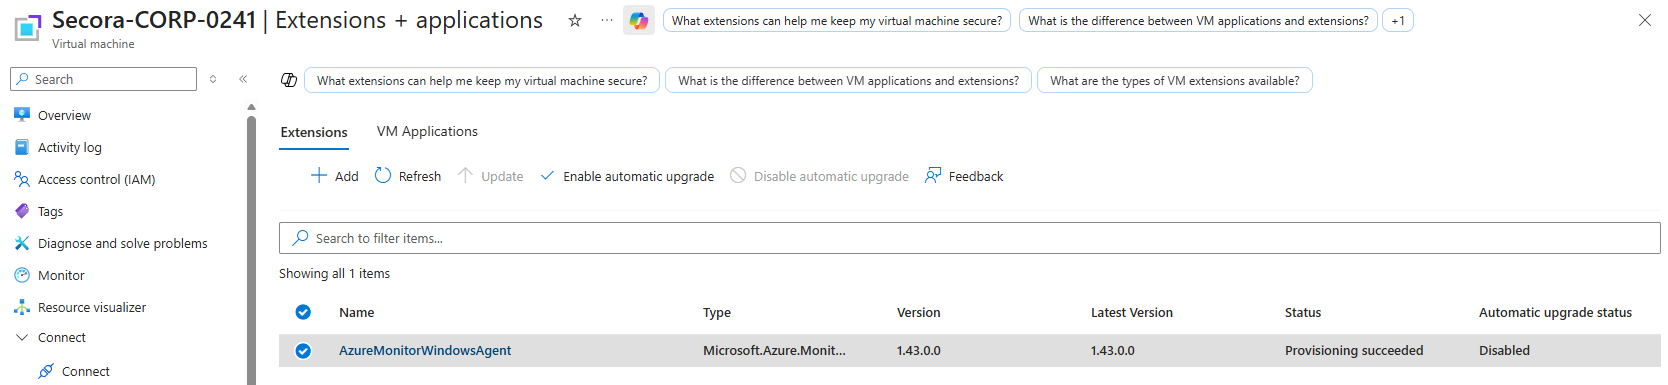
Give it five to ten minutes. The agent installs as a VM extension after the rule is created, and there's an initialization window where queries return nothing. If you query immediately and panic, you'll waste an hour troubleshooting a thing that just needed to finish booting.
Step 5: Run Your First KQL Query#
Sentinel queries are written in KQL, Kusto Query Language. It's Microsoft's own powerful query language used primarily for retrieving and processing data in Azure services like Azure Data Explorer and Azure Monitor. Which means Querying logs is a non-negotiable skill in security operations. Depending on where you land you'll be working in SQL, KQL, or SPL, but they're close enough cousins that learning one makes the others easy to pick up. Microsoft and Sentinel run on KQL, which you can practice for free at KC7 Now let's prove data is flowing by running our first query.
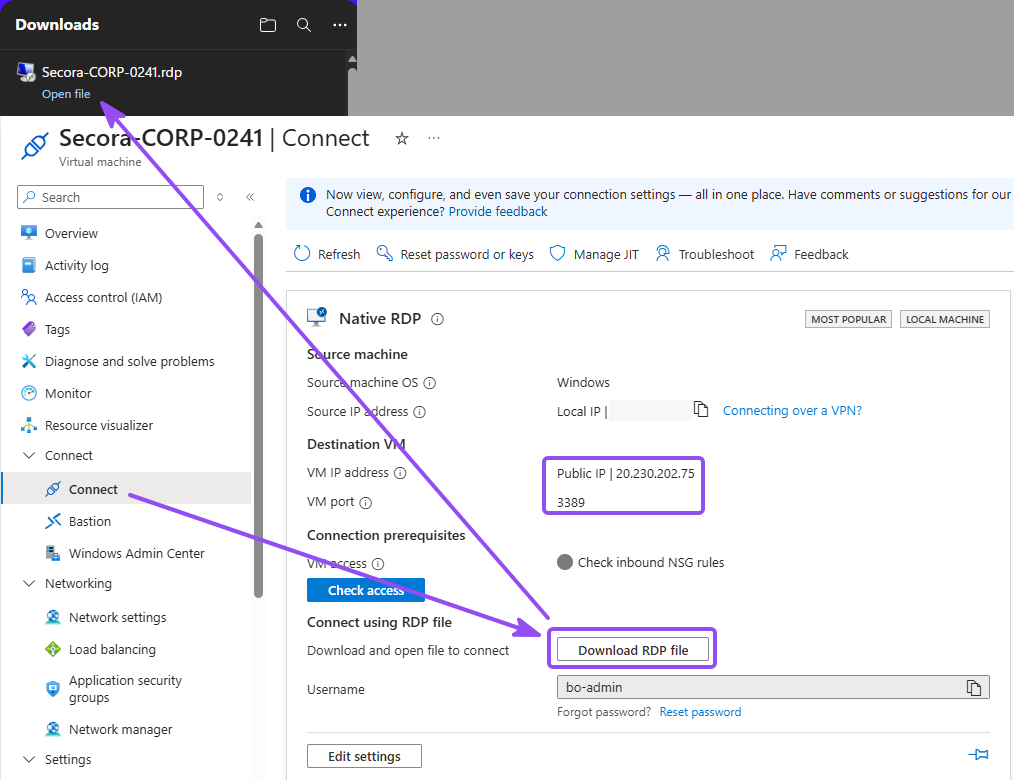
- RDP into the VM once using its public IP, so there's at least one logon event to find. Easiest way to do this is by going to your virtual machine, under <Connect, click on Download RDP file and open up that
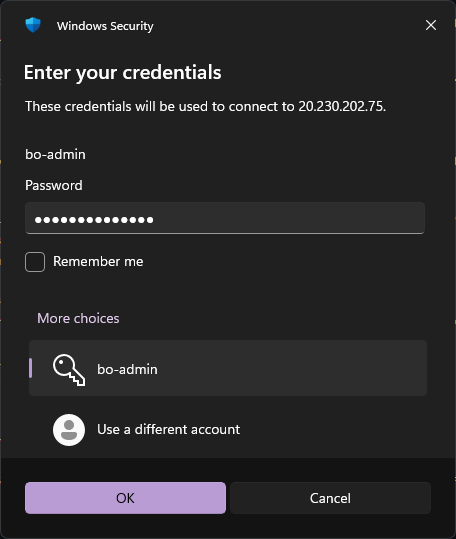
.rdp file - Sign in using the admin credentials you created earlier
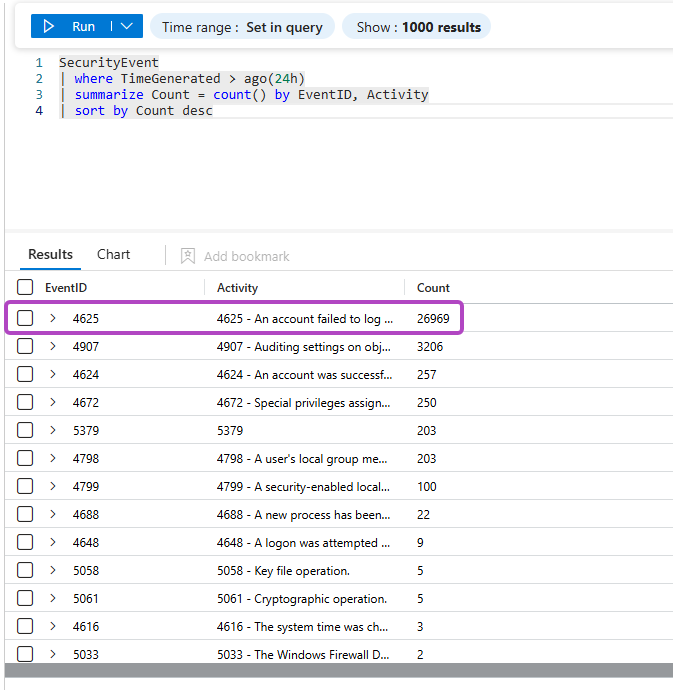
- In Sentinel, go to Logs, close the query gallery, and run:
SecurityEvent
| where EventID == 4625
Windows EventID 4625 means an attempted logon has failed. Which is a common indicator for brute-force or password spraying attacks.
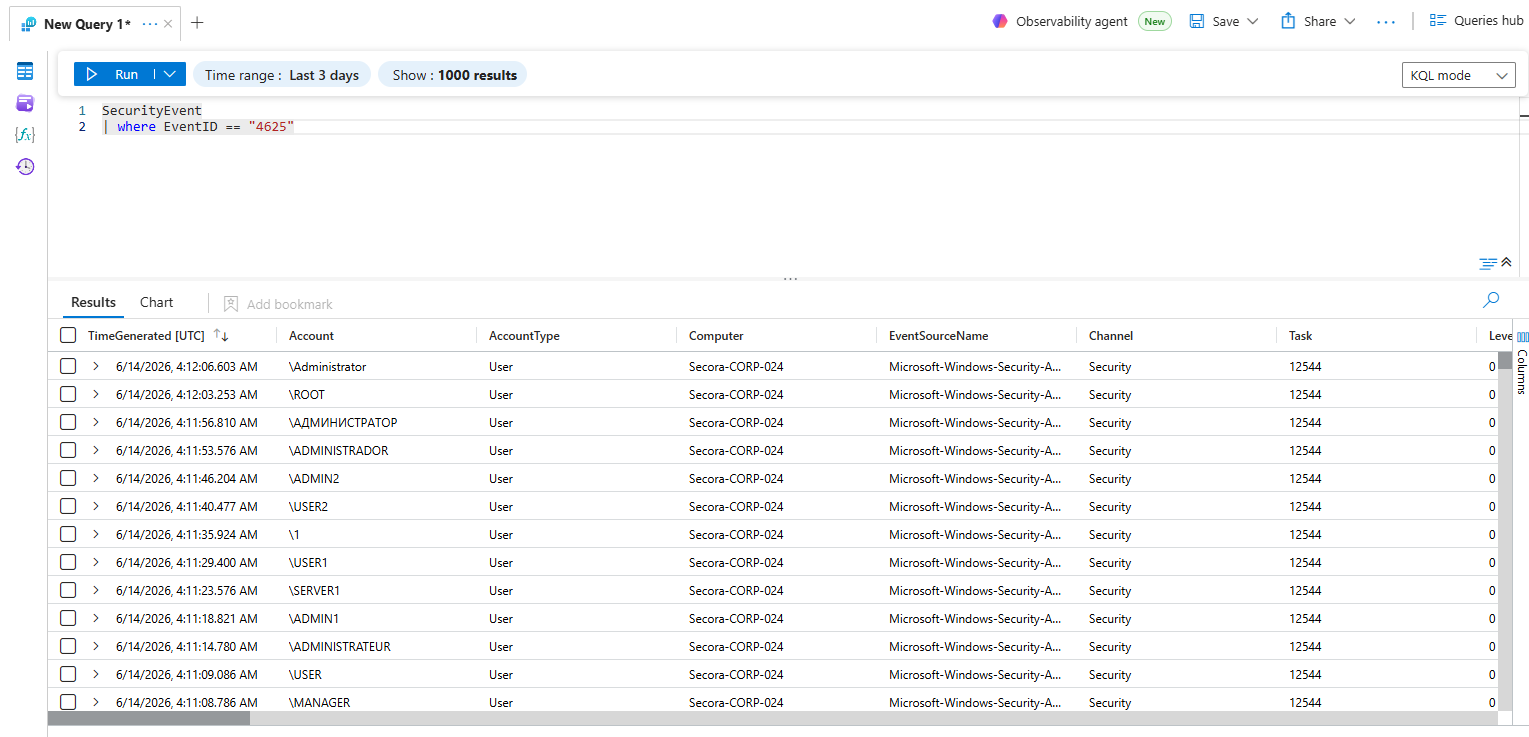
You should see failed-logon events in the results, each one a 4625. A raw count of them confirms the pipeline is live, but it doesn't yet separate a real campaign from background noise. It tells you data exists; it does not tell you anything an analyst would act on. This is where I took it a step further from the original tutorial and explore what I can do with it. Let's keep going.
Generating the Telemetry: A Self-Inflicted Attack Chain#
Before we write detections, it helps to have something to detect. The internet will happily supply a flood of failed logons, but the more interesting events, the ones that describe an attacker who already got in and is escalating, only show up if someone actually does those things on the box. So I did them myself, in attacker order, and watched each action land in the logs. Reading individual event IDs is table stakes. What actually shows fluency is correlating them, tying one action to the exact events it produces and explaining why the sequence matters.
The whole point is the chain. Run these in order and the logs read like a real intrusion walking from initial access through persistence to evasion. Everything below is harmless, but each step has the same shape as the malicious version it stands in for.
Do this on the honeypot only. You're creating accounts, granting admin, and weakening audit policy on purpose. That's fine on a disposable VM that gets deleted at the end, and nowhere else.
1. Authentication: the 4625 to 4624 pivot
Start at the front door. Mistype the password at the RDP prompt a few times, then log in correctly. The failures
write 4625, the success writes 4624, and the field that proves you understand them is
the Logon Type. Type 2 is someone sitting at the keyboard, Type 3 is a network logon over SMB,
and Type 10 is RDP. A Type 10 success from an IP you don't recognize is the exact thing you build an alert
around. The moment you log in as an admin, you'll also see 4672 fire alongside your 4624,
because that event marks the special privileges handed to an elevated session.
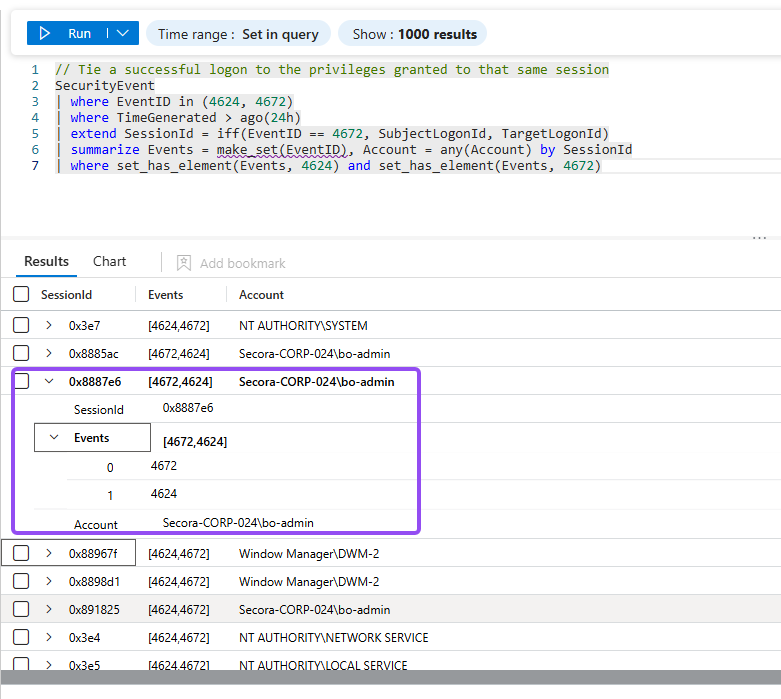
// Tie a successful logon to the privileges granted to that same session.
// 4624 stores the session in TargetLogonId, 4672 in SubjectLogonId, so normalize to one key.
SecurityEvent
| where EventID in (4624, 4672)
| where TimeGenerated > ago(24h)
| extend SessionId = iff(EventID == 4672, SubjectLogonId, TargetLogonId)
| summarize Events = make_set(EventID), Account = any(Account) by SessionId
| where set_has_element(Events, 4624) and set_has_element(Events, 4672)
Correlating 4624 and 4672 on a shared Logon ID, the hex value that stitches one session together.
Not every 4624 is a person. The first time you query for successful logons, most of what
comes back won't be you. Windows logs a steady stream of them from non-human accounts, and they split by logon
type: SYSTEM, LOCAL SERVICE, and NETWORK SERVICE come in as
LogonType 5 (Service), while the Desktop Window Manager (DWM-N) and font driver host
(UMFD-N) virtual accounts log on as LogonType 2 (Interactive). None of them carry a
remote source IP. Your actual RDP session, by contrast, is LogonType 10 with a real source IP and
the account you logged in with. Here's the trap: Type 2 covers both a human at the console and the DWM virtual
account, so logon type alone is never enough. You confirm a real session by combining type, account, and source
IP, which is why the detections key on LogonType == 10 and a real user instead of trusting the
event ID alone. Reading logs well is mostly knowing which events to ignore.
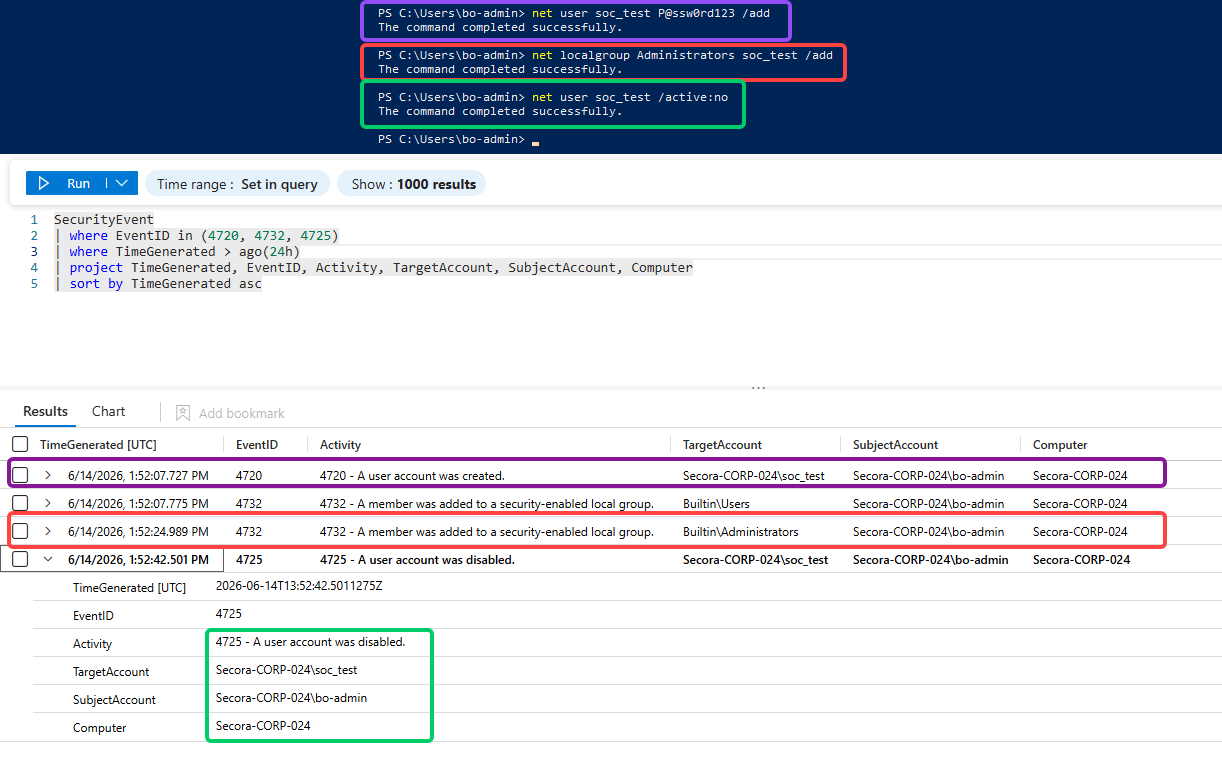
2. Persistence: create an account and promote it
Attackers who get in want to stay in, and the classic way is to create their own account and quietly add it to the local Administrators group. Open an elevated PowerShell on the VM and do exactly that:
net user soc_test P@ssw0rd!23 /add        # writes 4720 (account created)
net localgroup Administrators soc_test /add  # writes 4732 (added to admin group)
net user soc_test /active:no              # writes 4725 (account disabled)
A full account lifecycle in three commands, each one a distinct security event.
The detection story is the timing. A 4720 followed seconds later by a 4732 adding that
brand-new account to Administrators is textbook privilege escalation. This is also the exact event the
4732 rule in the next step is built to catch, so running it now means you have a real hit to point
at instead of waiting on an attacker to oblige.
3. Lateral movement: explicit credentials
When an attacker has stolen creds and wants to use them somewhere new, they often run a process as a different
user. That writes 4648, a logon using explicit credentials, the same event runas and
tools like PsExec produce. A harmless runas against the account you just made is enough to generate
it:
runas /user:soc_test cmd # writes 4648 (explicit-credential logon)4648 is a quiet but reliable signal of credentials being reused across a session boundary.
4. Execution: a 4688 that looks like trouble
Process creation is one of the most useful events in any SOC, but Windows doesn't capture command lines in
4688 by default, so turn that on first. Then run something benign that has the exact silhouette of
malicious tooling:
// Capture command lines in 4688 events
reg add "HKLM\SOFTWARE\Microsoft\Windows\CurrentVersion\Policies\System\Audit" `
  /v ProcessCreationIncludeCmdLine_Enabled /t REG_DWORD /d 1 /f

// Generate a 4688 with an encoded command (this just decodes to "test")
powershell.exe -nop -w hidden -enc dGVzdA==
The payload is nothing, but the shape (hidden window, encoded command) is what real malware looks like.
That second command decodes to the harmless string test, yet it carries every hallmark analysts
hunt for: a hidden window and a base64-encoded command. The standard detection matches 4688 events
whose command line carries those markers:
SecurityEvent
| where EventID == 4688
| where CommandLine has_any ("-enc", "-encodedcommand", "FromBase64String")
| project TimeGenerated, Computer, Account, NewProcessName, CommandLine
Catching encoded PowerShell by its command line, one of the highest-value process detections you can write.
5. Defense evasion: going dark
The last move in the chain is the attacker covering their tracks. Weakening the audit policy writes
4719, and clearing the Security log outright writes 1102. Both say the same thing: someone
is trying to stop you from seeing what happens next.
auditpol /set /category:"Logon/Logoff" /success:disable # writes 4719Tampering with logging is high-severity by itself; defenders rarely have a benign reason to do it.
Laid end to end, that's a complete intrusion narrative: a brute-force burst, a successful elevated logon, a new account promoted to admin, those credentials reused, an encoded payload executed, and the logs tampered with to hide it. Here's the whole chain in one place, which doubles as a reference for the IDs worth knowing cold.
| Event ID | What it means | How to generate it | ATT&CK stage |
|---|---|---|---|
| 4625 | Failed logon | Wrong password at RDP (or just wait) | Initial Access |
| 4624 | Successful logon | Log in correctly | Initial Access |
| 4672 | Special privileges assigned | Log in as an admin | Privilege Escalation |
| 4720 | Account created | net user /add | Persistence |
| 4732 | Added to local admin group | net localgroup Administrators /add | Privilege Escalation |
| 4725 | Account disabled | net user /active:no | Persistence cleanup |
| 4648 | Explicit-credential logon | runas | Lateral Movement |
| 4688 | Process created | Run any command (with cmdline auditing on) | Execution |
| 4719 | Audit policy changed | auditpol /set | Defense Evasion |
| 1102 | Security log cleared | Clear the log in Event Viewer | Defense Evasion |
Step 6: Write Sharper Detections#
Real detections key on event IDs, which are specific, stable, and fast. Event ID 4625 is a
failed logon. A single one is meaningless; ten from the same IP in ten minutes is a campaign. Run each query below
in Logs and you'll watch the noise resolve into signal.
6.1: Brute-force attempts (failed logons over a threshold)
// Brute-force signature: rapid failed logons (Event ID 4625) per source IP
let threshold = 10;
SecurityEvent
| where EventID == 4625
| where TimeGenerated > ago(1h)
| summarize
    FailedAttempts   = count(),
    FirstAttempt     = min(TimeGenerated),
    LastAttempt      = max(TimeGenerated),
    AccountsTargeted = dcount(TargetAccount)
    by IpAddress, Computer
| where FailedAttempts >= threshold
| extend DurationMin = datetime_diff('minute', LastAttempt, FirstAttempt)
| project IpAddress, Computer, FailedAttempts, AccountsTargeted,
          FirstAttempt, LastAttempt, DurationMin
| sort by FailedAttempts desc
Counting failures per IP and only surfacing the ones past a threshold.
6.2: Brute-force success (the one that actually means trouble)
The higher-fidelity detection is a successful logon (4624) from an IP that was just throwing
failures at you. That's a brute-force that worked. Joining the two event streams turns a noisy signal into a
precise one, and the MITRE technique is annotated right in the query so the mapping travels with the alert.
// Brute-force SUCCESS: a 4624 logon from an IP that was just failing (4625)
let lookback = 1h;
let failThreshold = 5;
let bruteForceIPs =
    SecurityEvent
    | where TimeGenerated > ago(lookback)
    | where EventID == 4625
    | summarize FailCount = count() by IpAddress
    | where FailCount >= failThreshold
    | project IpAddress;
SecurityEvent
| where TimeGenerated > ago(lookback)
| where EventID == 4624
| where LogonType == 10          // 10 = RemoteInteractive (RDP)
| join kind=inner bruteForceIPs on IpAddress
| project TimeGenerated, Computer, IpAddress, TargetAccount, AuthenticationPackageName
| extend MitreTactic    = "Initial Access",
         MitreTechnique = "T1110.001 - Brute Force: Password Guessing"
| sort by TimeGenerated desc
The success-after-failure pattern: low volume, high meaning.
Why filter on LogonType 10? It scopes the match to RDP sessions specifically, so you're not alerting on a local console logon that happens to follow some unrelated failures. Small filter, large difference in false-positive rate.
6.3: Post-compromise activity
Three more event IDs describe an attacker who is already in and trying to stay there or cover their tracks. In a honeypot those are gold, because reaching them means the brute-force succeeded and someone is now operating on the box.
// 4732: account added to a privileged local group (privilege escalation)
SecurityEvent
| where EventID == 4732
| where TargetAccount contains "Administrators"
| project TimeGenerated, Computer, SubjectAccount, MemberName, TargetAccount
| extend MitreTactic = "Privilege Escalation", MitreTechnique = "T1078 - Valid Accounts"

// 4719: audit policy changed (defense evasion / log tampering)
SecurityEvent
| where EventID == 4719
| project TimeGenerated, Computer, SubjectAccount, AuditPolicyChanges
| extend MitreTactic = "Defense Evasion", MitreTechnique = "T1562.002 - Disable Windows Event Logging"

// 4698: scheduled task created (persistence)
SecurityEvent
| where EventID == 4698
| project TimeGenerated, Computer, SubjectAccount, TaskName
| extend MitreTactic = "Persistence", MitreTechnique = "T1053.005 - Scheduled Task"
Three post-compromise detections the base tutorial never reaches for.
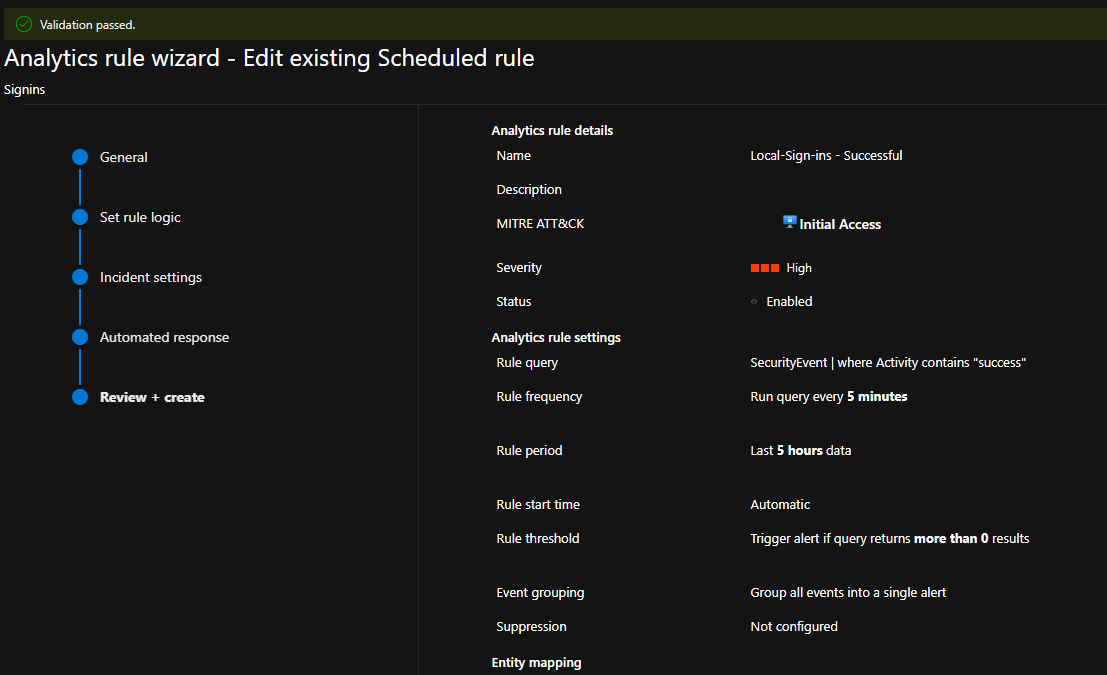
Step 7: Turn Queries into Alert Rules#
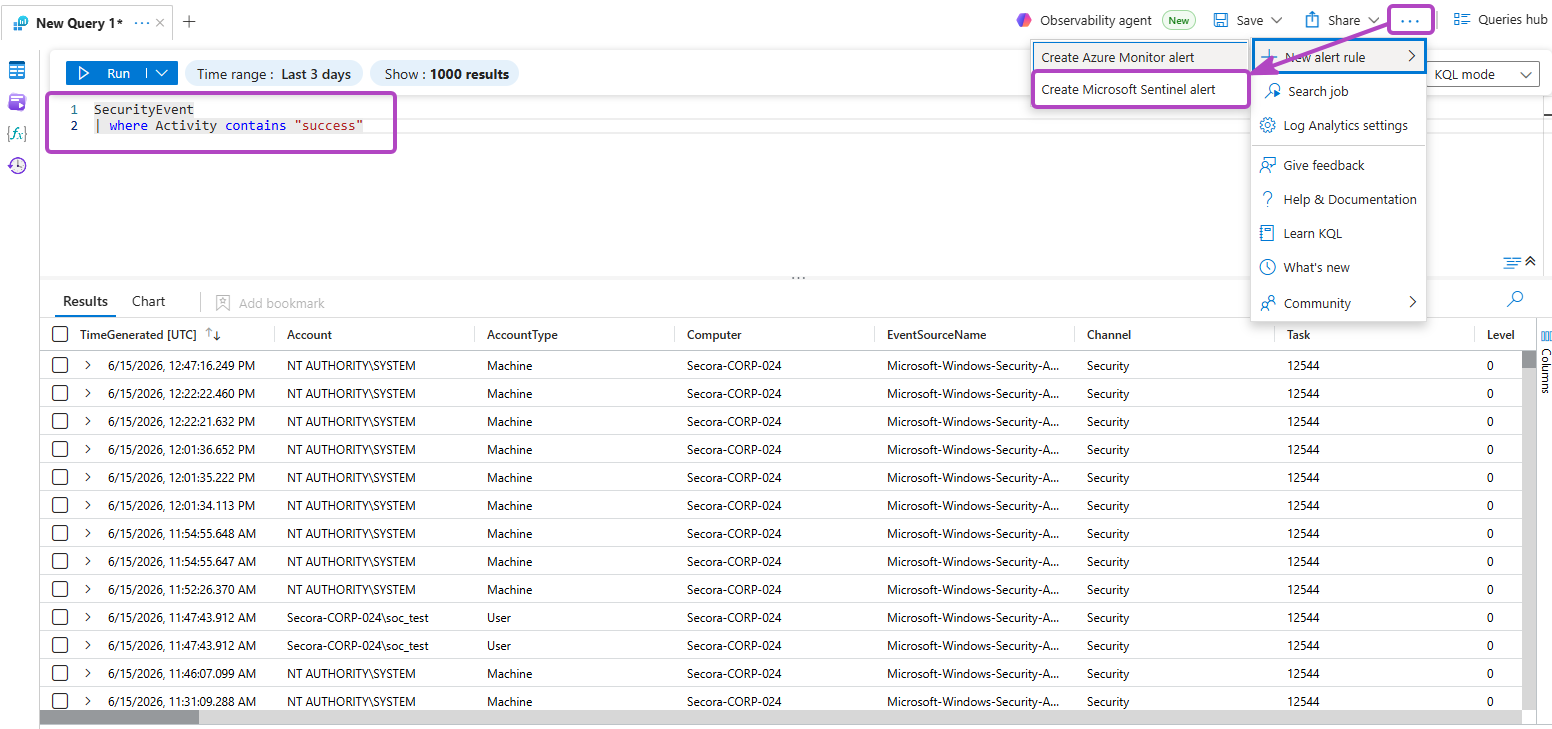
A query you run by hand is a hunt. A query Sentinel runs on a schedule is a detection. Let's promote them.
- In Logs, with your query open, click New alert rule → Create Microsoft Sentinel alert
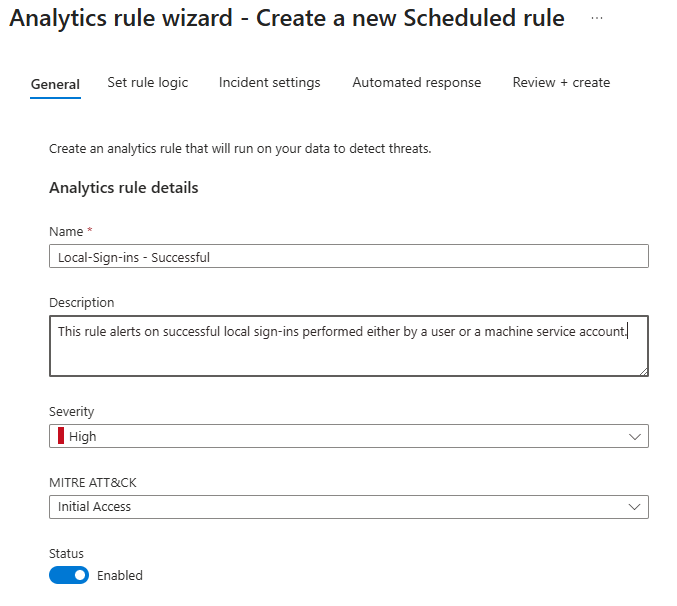
- Name the rule and set a severity (see the tiering below)
- Under MITRE ATT&CK, tag the matching tactic: Initial Access for the brute-force success rule, Persistence for the scheduled-task rule, and so on
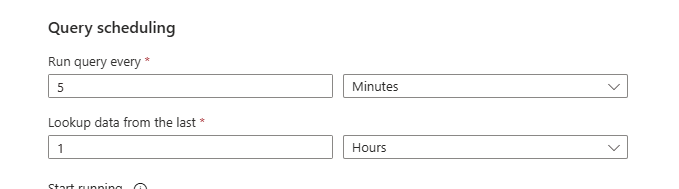
- On the rule logic tab, set Run query every 5 minutes with Lookup data from the last 1 hour
- Save, then repeat for each detection from Step 6
The grouping setting is the sanity-saver. A single determined IP can trip a brute-force rule hundreds of times in an hour. Grouped by source IP and a time window, that becomes one incident with a count, instead of a screen full of identical noise that buries anything real.
Here's everything that changed between the base tutorial and what we just built:
| Area | Base tutorial | What we ran instead |
|---|---|---|
| Detection logic | String match on "success" | Event-ID based (4624 / 4625 / 4719 / 4732 / 4698) with thresholds |
| Severity | One level for everything | Tiered: brute-force Medium, post-brute success High, policy change Critical |
| MITRE mapping | Single tactic in the UI | Tactic + technique embedded in the KQL so it rides into the incident |
| Lookback window | 5-min run, 5-min lookback | 5-min run, 1-hour lookback, which catches slow campaigns under the per-window bar |
| Entity mapping | Not configured | IP and Account mapped as entities, enabling the investigation graph and UEBA |
| Incident grouping | Default (one per alert) | Grouped by IP + 1-hour window, so one attacker can't cause an alert storm |
What Actually Showed Up#
Then I turned it on and waited, which did not take long. Internet-wide scanners find a fresh public IP almost immediately, and there is something genuinely sobering about watching the first failed-logon events roll in before you've finished your coffee. What the box recorded over the following day was less a trickle than a steady drumbeat.
| Metric | Value |
|---|---|
| Failed logons (4625) | 26,066 |
| Unique source IPs | 253 |
| Top source IP | 194.180.49.141 (19,735 attempts, ~76%) |
| Most-targeted username | ADMINISTRATOR (4,164) |
| Logon Type 3 (network) | 26,016 of 26,066 |
| Successful external logons | 0 |
One address did most of the work
The volume was lopsided in a way I did not expect. Of the 26,066 failures, 19,735 came from a single IP, 194.180.49.141, roughly 76% of everything. That kind of concentration is worth a closer look, so I ran the address through the same enrichment a SOC analyst would: WHOIS first, then reputation and scanning feeds.
- WHOIS: registered to a dedicated-server / hosting allocation, not a residential ISP
- VirusTotal: 5 of 91 vendors flagged it, including Fortinet, Criminal IP, and GreyNoise
- GreyNoise: classified as malicious
- Community reporting: prior RDP (3389) reconnaissance against multiple targets, mapped to MITRE ATT&CK
T1595(Active Scanning)
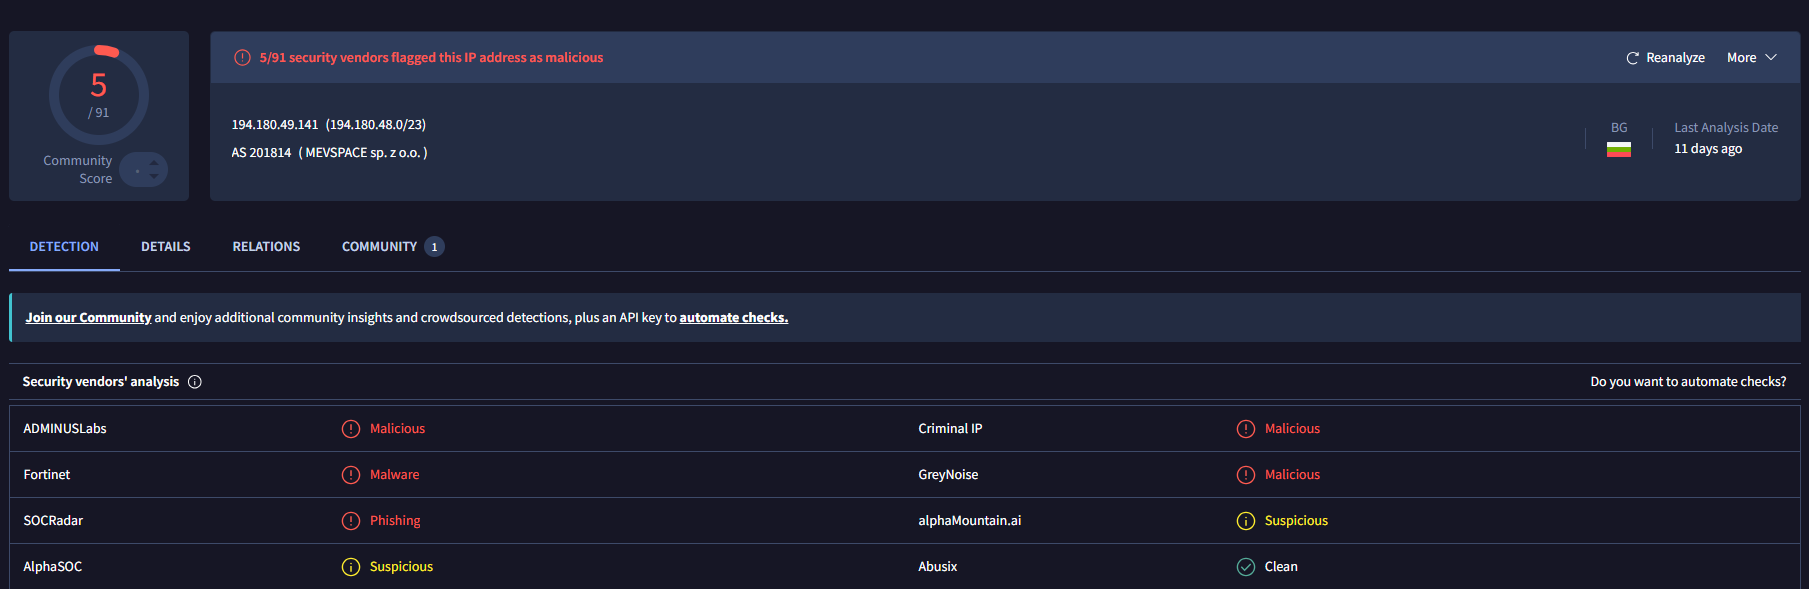
Read together, those signals all point the same direction: this looks like scanning infrastructure, not ordinary consumer traffic. But I want to be careful about how far that goes. Five of ninety-one vendors is a minority, community reports are not ground truth, and the registries did not even fully agree with each other (one placed the block in Germany, another tied the ASN to a provider in Bulgaria). WHOIS and reputation describe an address, not the person at the keyboard, and a rented server can be leased legitimately, compromised, or reused by different operators over time. So the honest read is a confidence boost, not a verdict: the activity was most likely part of broader scanning or credential-access operations, and the operator is unknown. The point was never attribution. It was concentration. Hundreds of sources touched the box, but three quarters of the noise came from one rented server methodically working a username list.
A note on attribution. External intelligence adds context, not certainty. It can tell you an address has a poor reputation; it cannot tell you who controlled it at the moment of the activity. The job of enrichment is to raise or lower confidence, never to name a culprit.
The usernames were a recycled dictionary
The targeted accounts were exactly the boring, predictable set, with ADMINISTRATOR alone drawing
4,164 attempts:
| Username | Attempts |
|---|---|
| ADMINISTRATOR | 4,164 |
| Administrator | 2,174 |
| USER | 1,354 |
| ADMIN | 1,354 |
| USER2 | 1,235 |
| ADMINISTRADOR | 1,235 |
| OPERATOR | 1,235 |
| ADMIN1 | 1,234 |
| SERVER1 | 1,234 |
| MANAGER | 1,234 |
The appearance of ADMINISTRADOR, the Spanish and Portuguese spelling, right next to the English
ADMINISTRATOR is a small tell that these came from multilingual, recycled credential lists rather
than anything aimed at me specifically. Automated tools cycle the obvious names first, every time.
The surprise: almost everything was Logon Type 3
Here's the detail I didn't expect, and the one that taught me the most. Almost every failure came in as Logon Type 3 (network), 26,016 of the 26,066, with essentially none as Type 10 (RemoteInteractive), even though RDP was the obvious door I had left open.
That looks contradictory until you remember how Windows logs remote authentication. With Network Level Authentication on, which is the default, a failed RDP credential check is rejected during the network-level handshake, before any interactive session is ever established, so Windows records it as a Type 3 network logon. Type 10 only appears once an interactive RDP session actually succeeds. SMB and other remote authentication against the wide-open box land as Type 3 as well. So Type 3 dominating is not evidence that this wasn't RDP. The top source was flagged for RDP reconnaissance specifically. It is evidence that nobody ever completed an interactive session. The absence of Type 10 from any external address is the finding.
This is the part I'd want a hiring manager to read. I went in assuming I'd be looking at RDP interactive logons (Type 10). The data said network logons (Type 3), and instead of forcing my assumption onto it, I worked out why the logs were correct and I was wrong. That's the difference between confirming what you already believe and actually reading the telemetry.
Nobody got in
The success side of the ledger is short. Every successful logon in the dataset traced back to one of two benign places: the local system and service accounts the OS generates on its own, and my own connection when I logged in to set the box up. Despite 26,066 failed attempts from 253 distinct addresses, not one external source ever authenticated successfully. The wide-open door drew a constant crowd, and the crowd never made it through.
The other thing I'll keep from running this: the event-ID detections produced zero false positives from the benign logoff events that the tutorial's string-match would have flagged. That isn't a dramatic result on its own. Combined with telemetry I generated myself and findings I could actually defend, it's the difference between a lab and a workflow.
What We've Accomplished#
- Deployed an internet-exposed Windows honeypot VM in an isolated Azure resource group
- Built the full telemetry pipeline: AMA agent → Data Collection Rule → Log Analytics → Sentinel
- Generated a full self-inflicted attack chain to produce the persistence, lateral-movement, execution, and evasion events the internet alone won't hand you
- Wrote event-ID-based KQL detections for brute force, brute-force success, privilege escalation, log tampering, and persistence
- Promoted them to analytics rules with MITRE ATT&CK mapping, entity mapping, tiered severity, and incident grouping
- Collected and analyzed real attack traffic: 26,066 failed logons, 253 source IPs, and a clear read on what was scanning versus what (nothing) actually got in
Tear it down. When you're done collecting, go to Resource groups, open
rg-honeypot-lab, and click Delete resource group. The honeypot's job is to exist
briefly, teach you something, and disappear.
Coming in Part 2#
The pipeline so far stops at the incident. An analyst still has to open each one and reconstruct, from raw event data, the story of what happened. That reconstruction is exactly the kind of work a language model is good at, so Part 2 bolts an AI triage layer onto the pipeline: a Logic App playbook that enriches each new incident with geo and ASN context, then has a model write an analyst-ready summary, MITRE mapping, and recommended actions as a comment before anyone opens it. The model advises; a human still pulls the trigger.
The findings this first half drove home, though, is smaller and more durable than any automation. You can read about RDP brute-force for years and it stays abstract. Open one real port to the internet, watch the attempts arrive within the hour, and it stops being abstract permanently. Build the detection around what you watched, not around what the tutorial told you to match, and the queries get sharper because you've seen the thing they're meant to catch.
Questions or Feedback?#
Feel free to connect with me on LinkedIn or reach out via email. I'd love to hear what showed up in your honeypot.
Built on the Josh Madakor's SIEM lab tutorial. Reference docs: Microsoft Sentinel, KQL, MITRE ATT&CK, Azure Logic Apps.